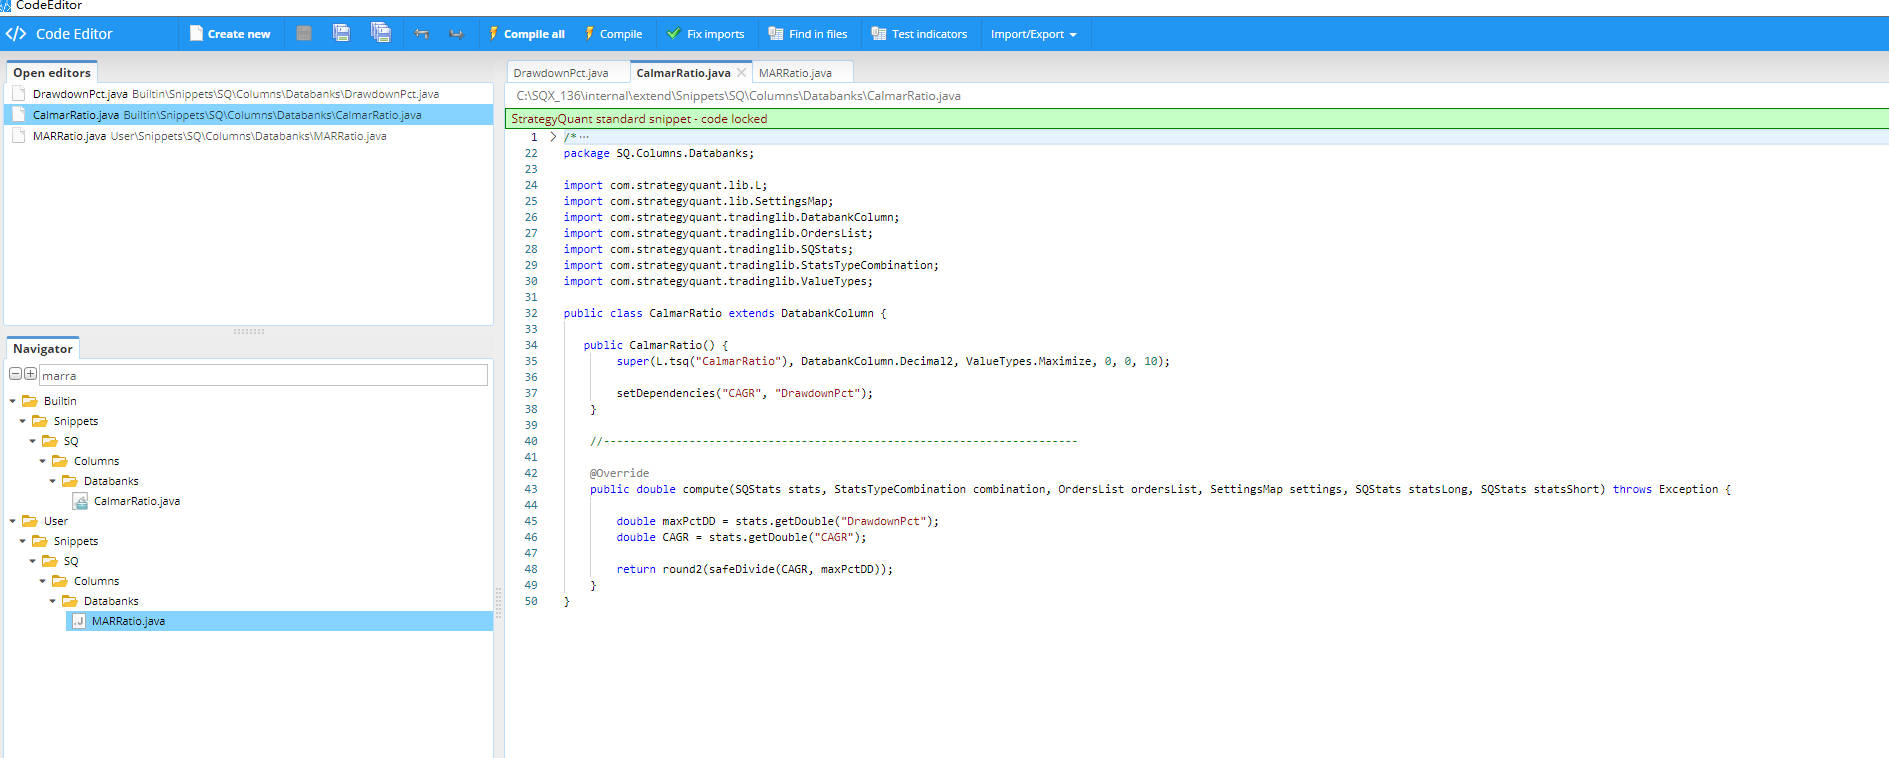
Calmar ratio metric calculation is wrong in SQX
As you can see from the code, Calmar ratio in SQ is actually MAR ratio (CAGR/Max% in SQX should be change to MAR ratio).
Please refer to the article for the historical
background, the differences, Pros&Cons between the two metric. https://www.investopedia.com/terms/m/mar-ratio.asp
For example, if Fund A(or portfolio A) has registered a compound annual growth rate
(CAGR) of 30% since inception, and has had a maximum drawdown of 15% in its
history, its MAR ratio is 2. If Fund B(or portfolio B) has a CAGR of 35% and a maximum drawdown
of 20%, its MAR ratio is 1.75. While Fund B has a higher absolute growth rate,
on a risk-adjusted basis, Fund A would be deemed to be superior because of its
higher MAR ratio.
But what if Fund B has been in existence for 20 years and Fund A has
only been operating for five years? Fund B is likely to have weathered more
market cycles by virtue of its longer existence, while Fund A may only have
operated in more favorable markets.
This is a key drawback of the MAR ratio since it compares results
and drawdowns since inception, which may result in vastly differing periods and
market conditions across different funds and strategies.
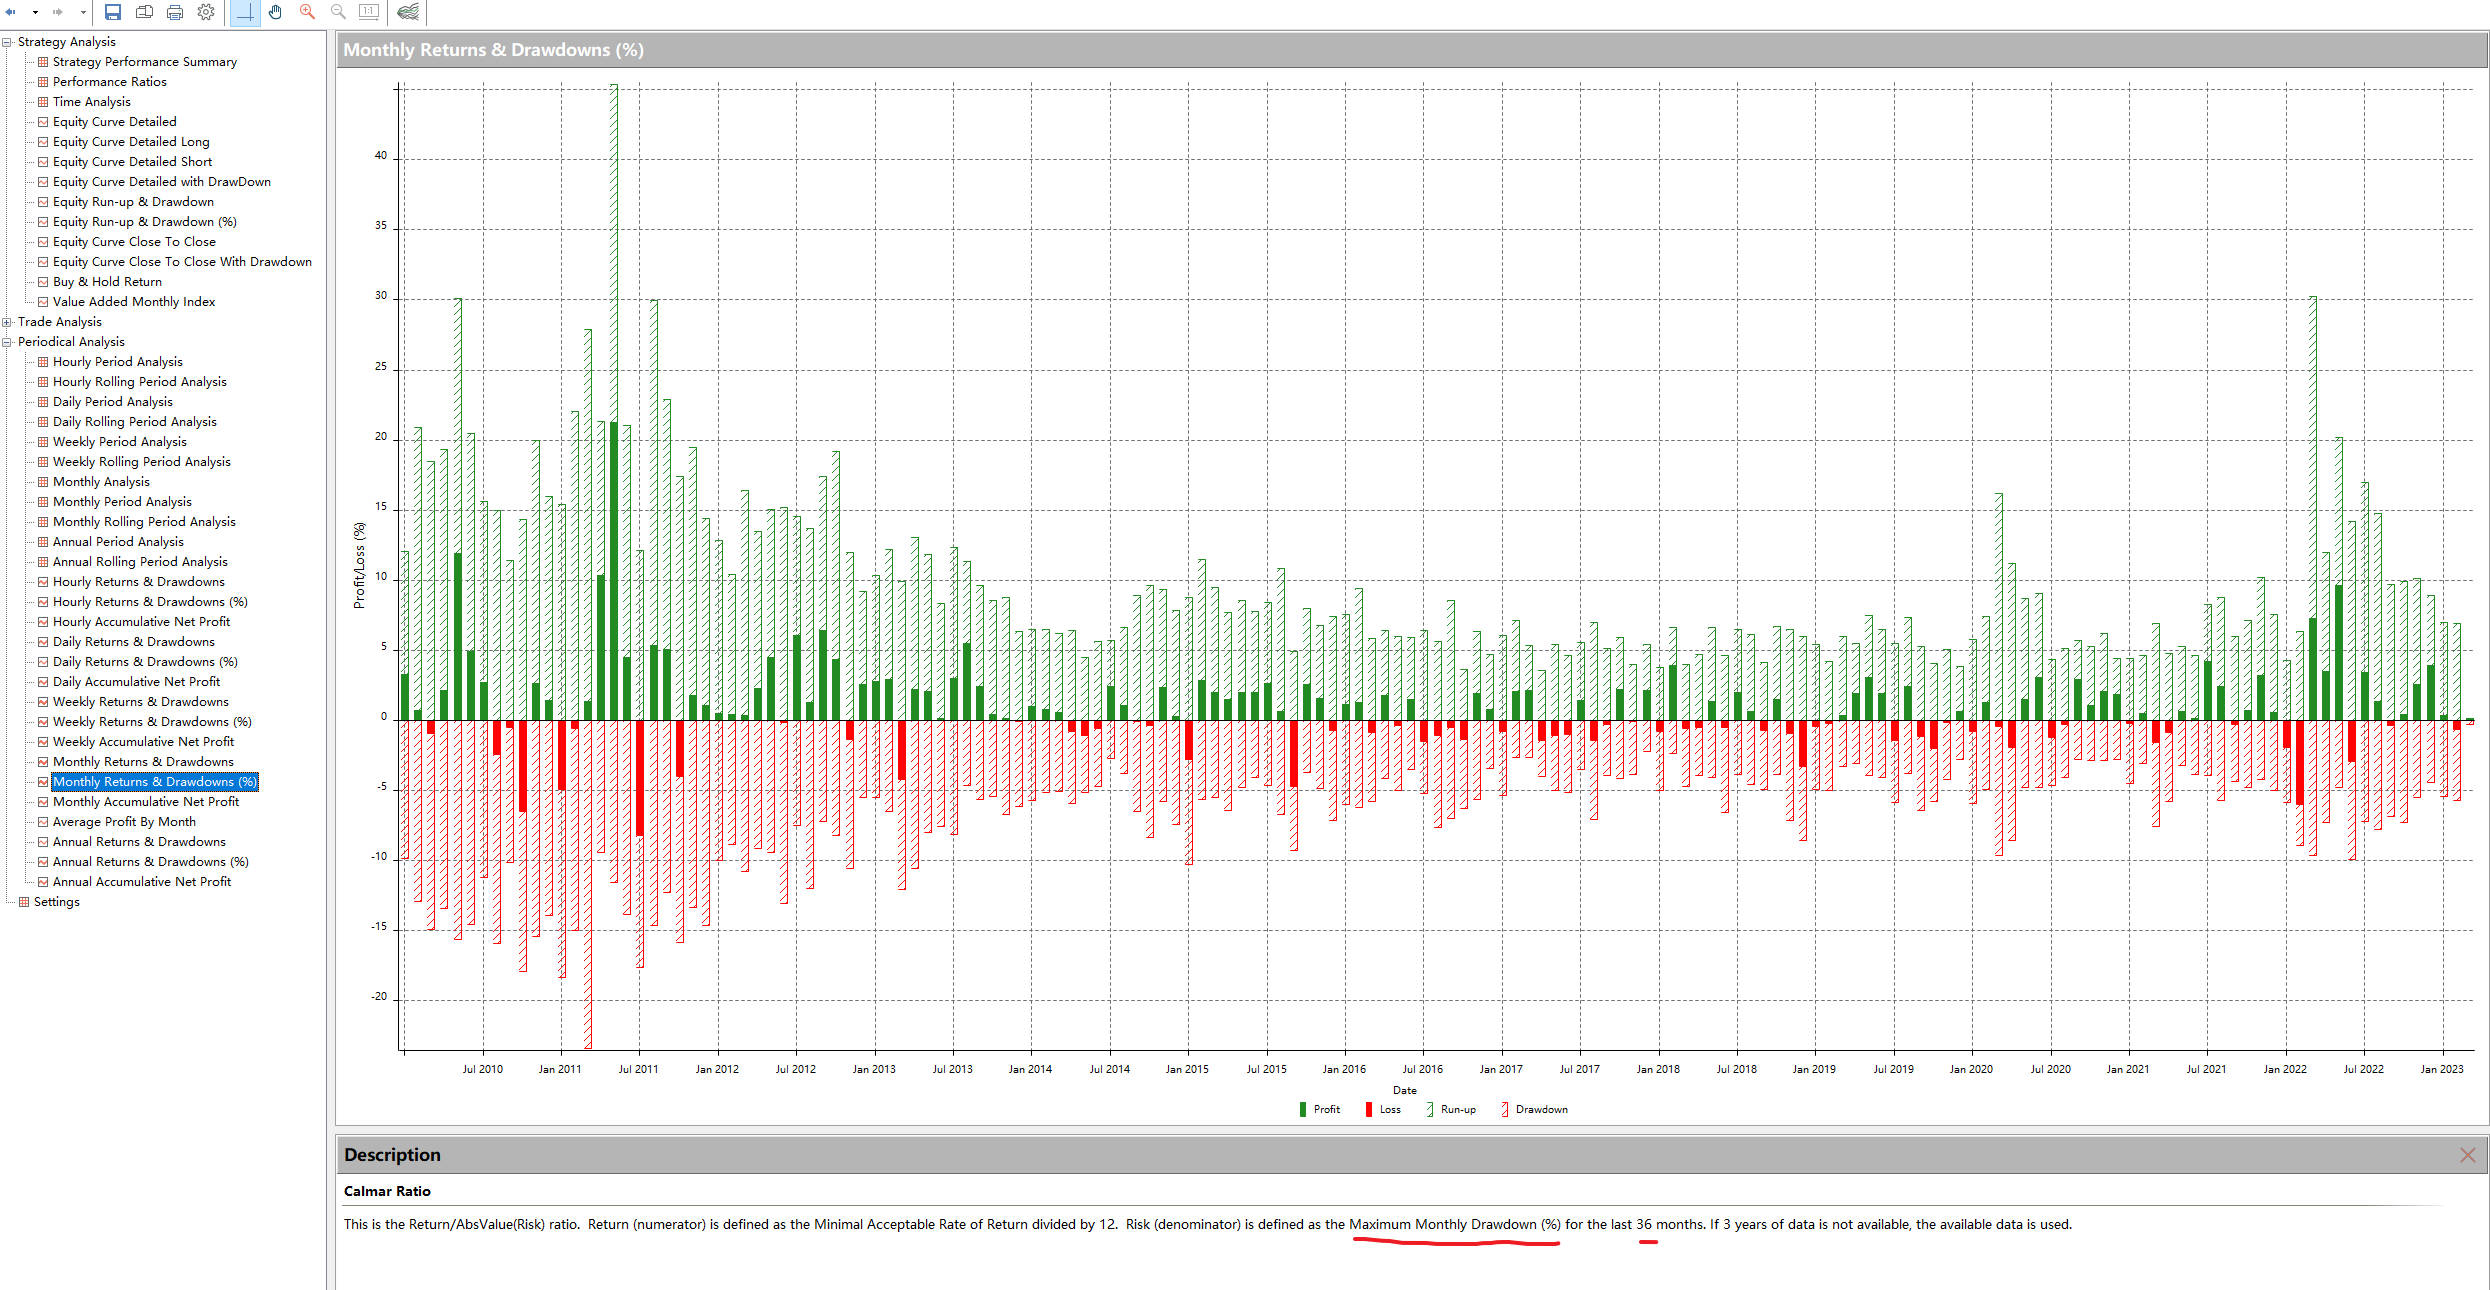
This drawback of the MAR ratio is overcome by another performance
metric known as the Calmar ratio, which considers compound annual returns and
drawdowns for the past 36 months only, rather than since inception.
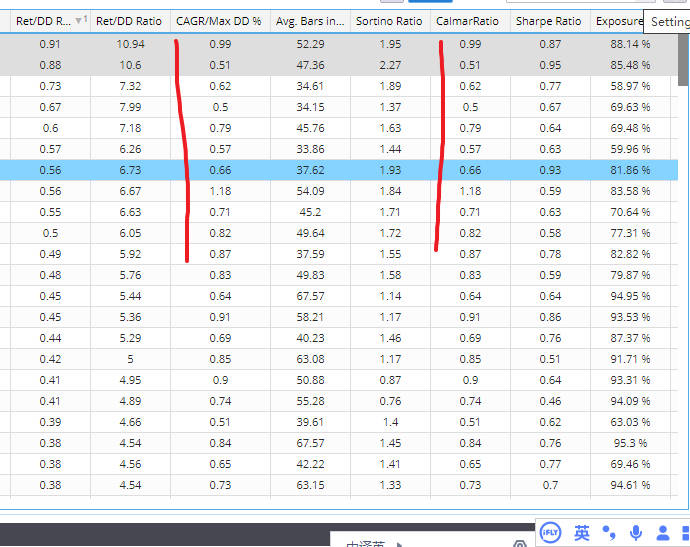
1.The MAR ratio and the Calmar ratio result
in vastly different numbers given the time period being analyzed. The Calmar
ratio is usually a more preferred ratio as it compares apples to apples in
terms of timeframe, hence being a more accurate representation of comparing
multiple funds or strategies.
2.Later versions of the Calmar ratio
introduce the risk free rate into the numerator to create a Sharpe type ratio.
As you can see the calculation formula of Calmar ratio in MC, This is again one of the computational differences between the two platforms.

-
Votes +2
-
Project StrategyQuant X
-
Type Bug
-
Status New
-
Priority Normal
History

binhsir
14.03.2023 12:24Description changed:
As you can see from the code, Calmar ratio in SQ is actually MAR ratio (It is labeled CAGR/Max% in SQX.).
Please refer to the article for the historical
background, the differences, Pros&Cons between the two metric. https://www.investopedia.com/terms/m/mar-ratio.asp
For example, if Fund A(or portfolio A) has registered a compound annual growth rate
(CAGR) of 30% since inception, and has had a maximum drawdown of 15% in its
history, its MAR ratio is 2. If Fund B(or portfolio B) has a CAGR of 35% and a maximum drawdown
of 20%, its MAR ratio is 1.75. While Fund B has a higher absolute growth rate,
on a risk-adjusted basis, Fund A would be deemed to be superior because of its
higher MAR ratio.
But what if Fund B has been in existence for 20 years and Fund A has
only been operating for five years? Fund B is likely to have weathered more
market cycles by virtue of its longer existence, while Fund A may only have
operated in more favorable markets.
This is a key drawback of the MAR ratio since it compares results
and drawdowns since inception, which may result in vastly differing periods and
market conditions across different funds and strategies.
This drawback of the MAR ratio is overcome by another performance
metric known as the Calmar ratio, which considers compound annual returns and
drawdowns for the past 36 months only, rather than since inception.
1.The MAR ratio and the Calmar ratio result
in vastly different numbers given the time period being analyzed. The Calmar
ratio is usually a more preferred ratio as it compares apples to apples in
terms of timeframe, hence being a more accurate representation of comparing
multiple funds or strategies.
2.Later versions of the Calmar ratio
introduce the risk free rate into the numerator to create a Sharpe type ratio.
As you can see the calculation formula of Calmar ratio in MC, This
is again one of the computational differences between the two platforms.
binhsir
14.03.2023 12:27Description changed:
As you can see from the code, Calmar ratio in SQ is actually MAR ratio (CAGR/Max% in SQX should be change to MAR ratio).
Please refer to the article for the historical
background, the differences, Pros&Cons between the two metric. https://www.investopedia.com/terms/m/mar-ratio.asp
For example, if Fund A(or portfolio A) has registered a compound annual growth rate
(CAGR) of 30% since inception, and has had a maximum drawdown of 15% in its
history, its MAR ratio is 2. If Fund B(or portfolio B) has a CAGR of 35% and a maximum drawdown
of 20%, its MAR ratio is 1.75. While Fund B has a higher absolute growth rate,
on a risk-adjusted basis, Fund A would be deemed to be superior because of its
higher MAR ratio.
But what if Fund B has been in existence for 20 years and Fund A has
only been operating for five years? Fund B is likely to have weathered more
market cycles by virtue of its longer existence, while Fund A may only have
operated in more favorable markets.
This is a key drawback of the MAR ratio since it compares results
and drawdowns since inception, which may result in vastly differing periods and
market conditions across different funds and strategies.
This drawback of the MAR ratio is overcome by another performance
metric known as the Calmar ratio, which considers compound annual returns and
drawdowns for the past 36 months only, rather than since inception.
1.The MAR ratio and the Calmar ratio result
in vastly different numbers given the time period being analyzed. The Calmar
ratio is usually a more preferred ratio as it compares apples to apples in
terms of timeframe, hence being a more accurate representation of comparing
multiple funds or strategies.
2.Later versions of the Calmar ratio
introduce the risk free rate into the numerator to create a Sharpe type ratio.
As you can see the calculation formula of Calmar ratio in MC, This is again one of the computational differences between the two platforms.
© Copyright. All rights reserved. ProjectPanel.com
