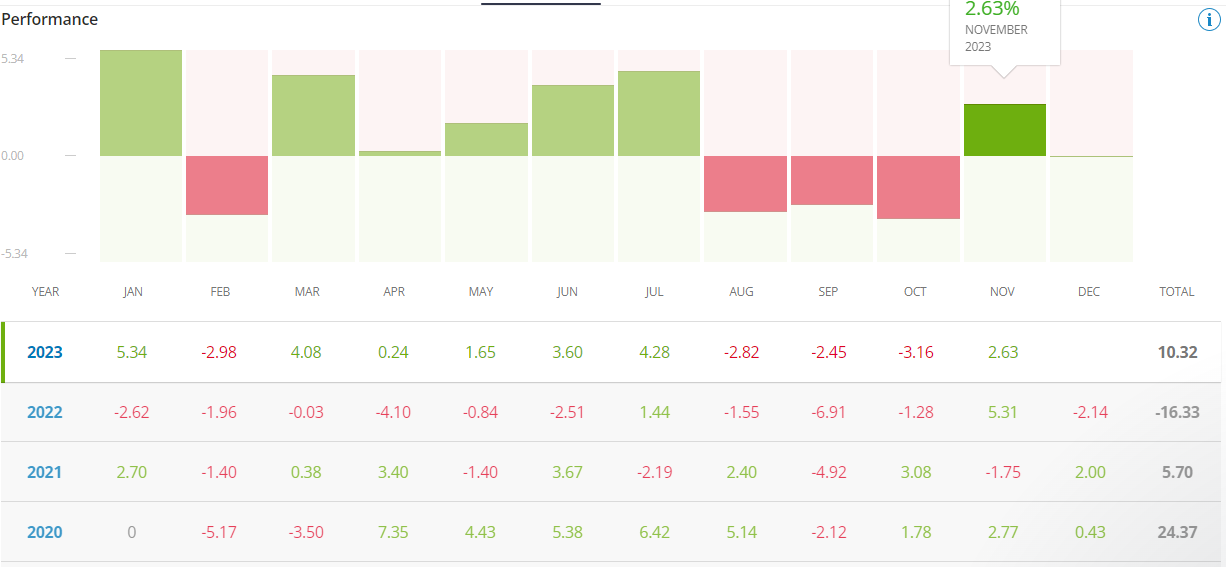
Monthly Performance - percent view
Hi! I have a request that has been on my mind for a few years now.
If you see a monthly performance table it is great to use it in dollars, but only if you use fixed $MM. By using MM% the table shows an exponential $ increase and is totally not clear (see screen 1).
If you see a monthly performance table it is great to use it in dollars, but only if you use fixed $MM. By using MM% the table shows an exponential $ increase and is totally not clear (see screen 1).
In my opinion, the most natural alternative way of reading this table in both scenarios would be a percent view (based on current equity - eg. at the beginning of each month)
This kind of view is not available in SQX but could be very useful.
1. Please see the screen of Amibroker software, where this view is very clear for users.
2. Other example is an Etoro way of visualizing the performance.
Here are some tips about the formulas https://www.etoro.com/news-and-analysis/etoro-updates/new-user-stats-page/
My request is to add this kind of view as an extra view in SQX and maybe also in Algocloud :)
Thanks!
Michal


-
Votes 0
-
Project StrategyQuant X
-
Type Feature
-
Status New
-
Priority Normal
History
m
Votes: 0
© Copyright. All rights reserved. ProjectPanel.com
