SQX 111 - MFE / MAE values on equity chart do not match values in trade list
I have noticed that the MFE / MAE values on the equity chart do not appear to match the values on the trade list. See attached screenshots.
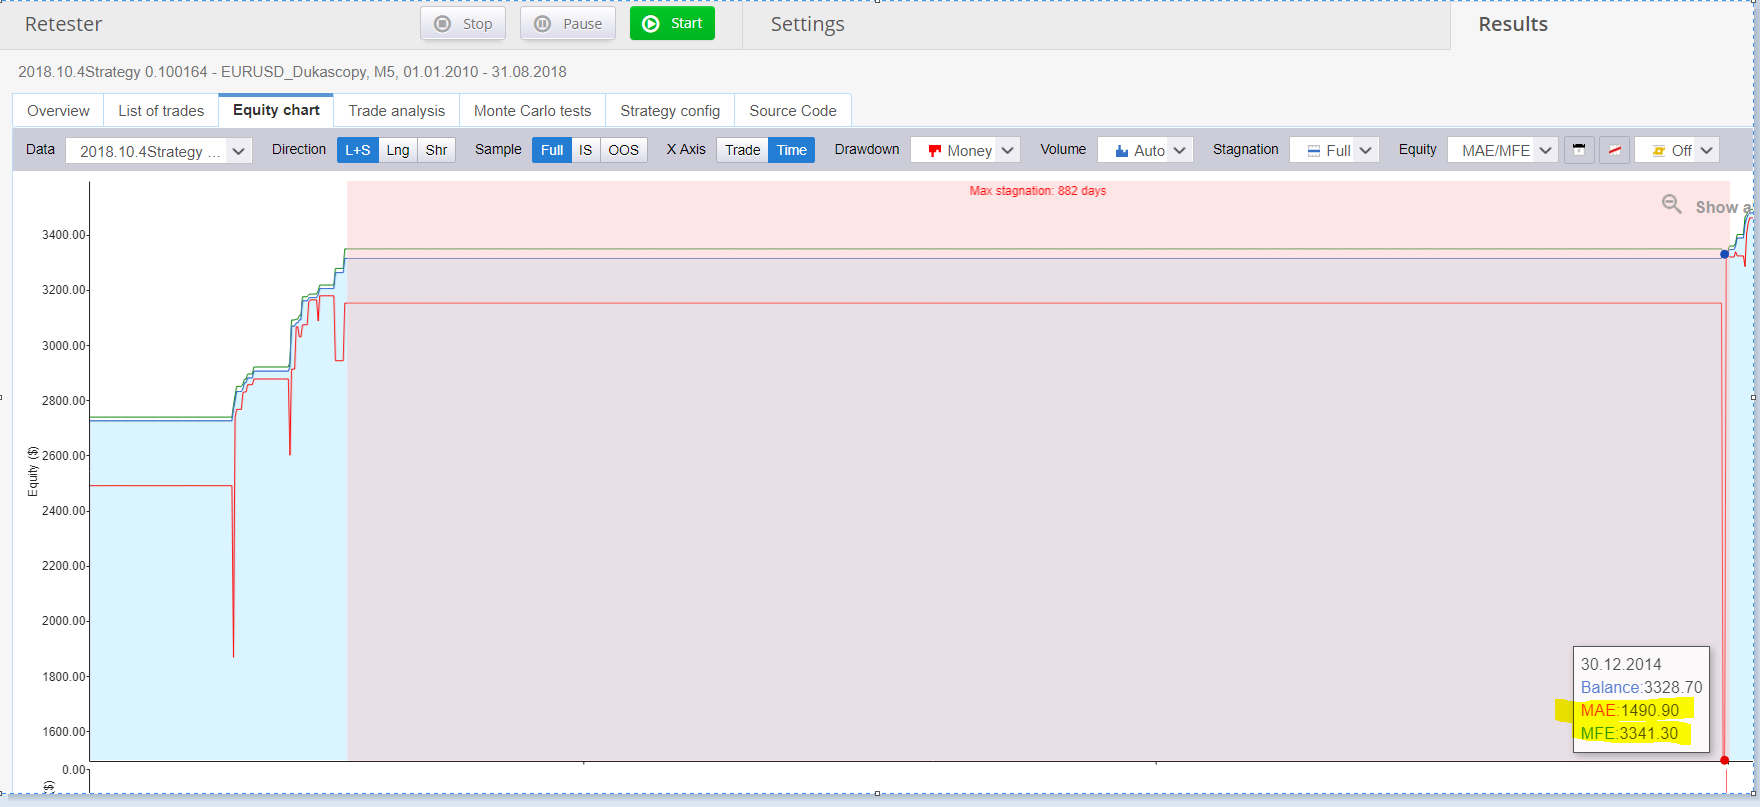
Basically the equity chart shows (in the square pop up window):
Balance: 3328.70
MAE: 1490.90
MFE: 3341.30
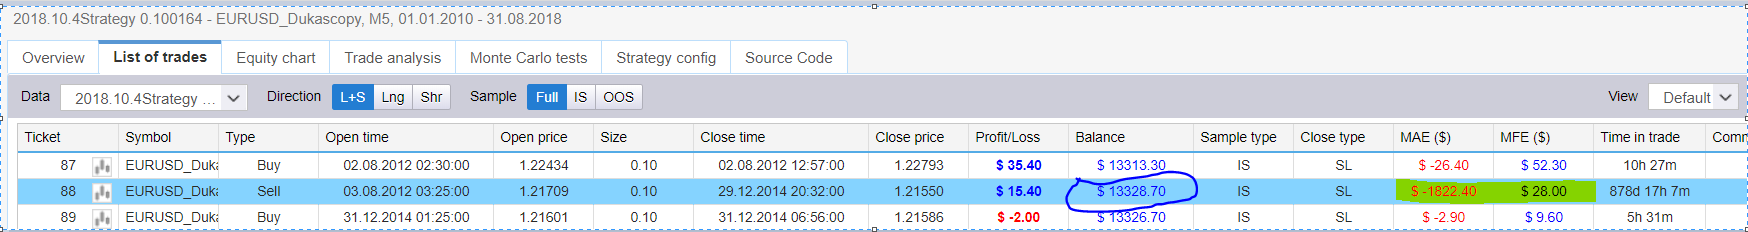
Trade open during this period:
Balance: 13328.70 (initial $10K start so correct)
MAE: -1822.40
MFE: 28
Although the MFE is close, the MAE looks completely wrong on the chart.
If the MAE on the trade is -1822.40 and the equity is 3328.70, the low point of the MAE on the chart should be at 1506.30, however the values plotted appear incorrectly shown.
Can you please check the equity chart values against the trade list values, seems like a bug to me.
Thanks,
Mike

-
Votes 0
-
Project StrategyQuant X
-
Type Bug
-
Status Refused
-
Priority Normal
History
© Copyright. All rights reserved. ProjectPanel.com

The balance was $13313.3 and when you do the calculation, you get:
MAE = $13313.3 + order #88 MAE ($-1822.4) = $11490.9 -> value 1490.9 in the equity chart
MFE = $13313.3 + order #88 MAE ($28) = $13341.3 -> value 3341.3 in the equity chart