On the calculation of spread
In MT5, for example,when the historical back test is carried out, the net profit is 1 million when the spread is set to 1, 900000 when
the spread is set to 2, and 800000 when the spread is set to 3. That is to say, in MT5, the same strategy, with the increase of the
spread setting value, the corresponding performance is equal difference reduction, and through the observation of the transaction list,
The impact on the performance of each transaction is an integral multiple of one tick value.
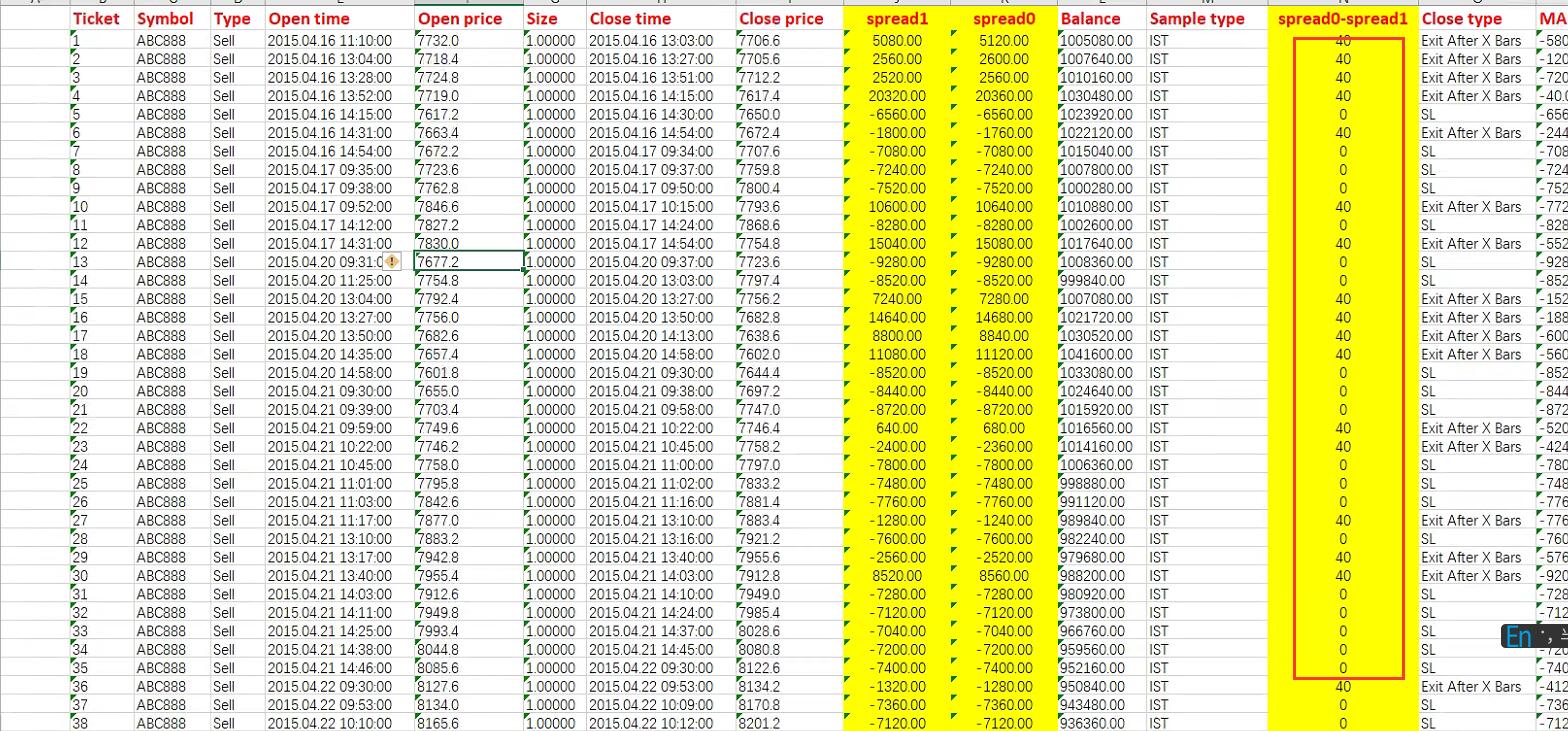
However, when testing in SQ, the results are a little incomprehensible. For details, please refer to the excel table in the attachment,
which are two lists with spread is 0 and spread is 1 respectively. Table 3 shows the calculation of the profit difference between the
two tables of spread 0 and spread 1. You can see that the difference in the front part of table3 is 0 or 40 (the amount of 1 tick value),
which is normal.
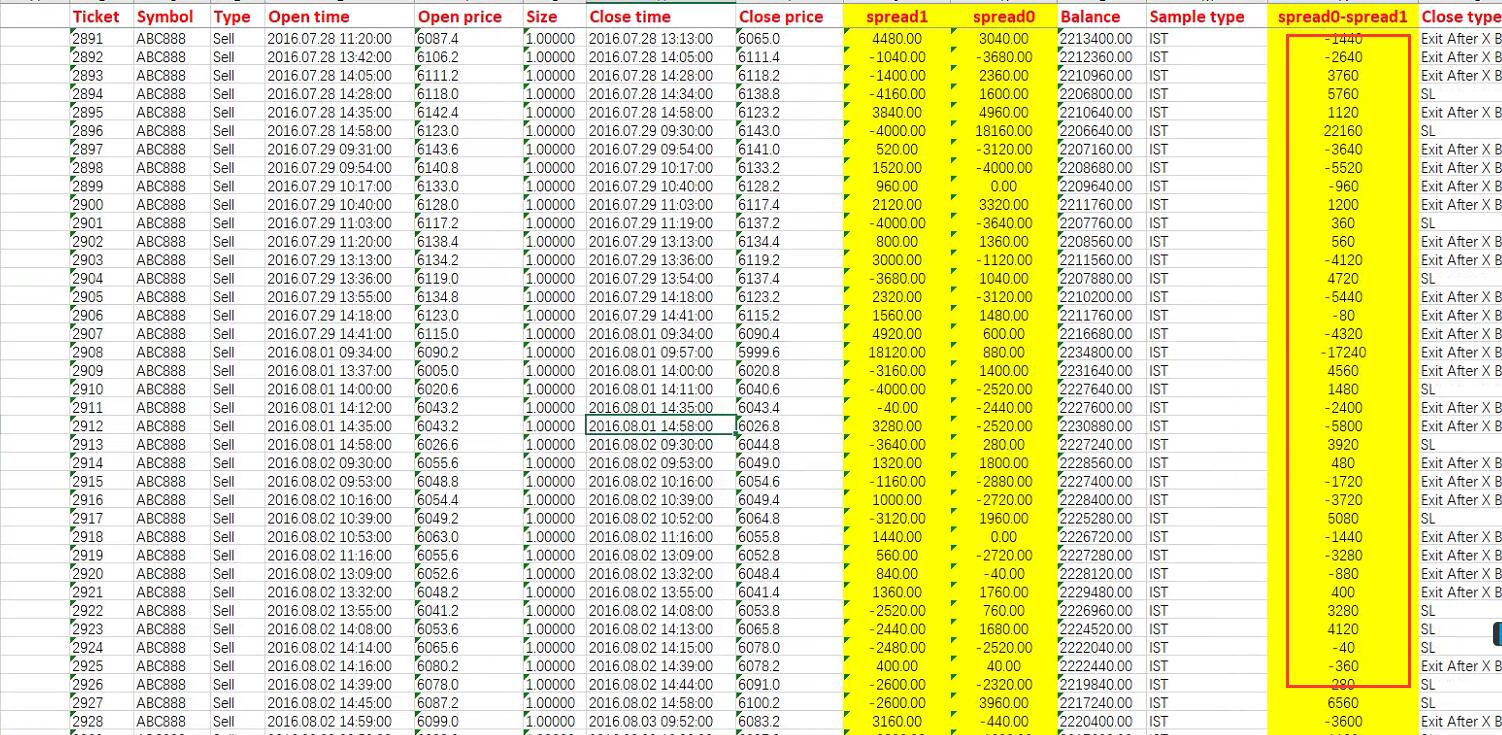
But after that, the difference becomes very large and irregular. Obviously, the transaction list with spread of 1 has changed. I feel
that this is not normal. Please check the problem.


-
Votes +1
-
Project StrategyQuant X
-
Type Bug
-
Status Refused
-
Priority Normal
History
Tamas
12.09.2022 06:17Status changed from New to Refused
© Copyright. All rights reserved. ProjectPanel.com
