MC Retest Result options for IS/OOS/Full
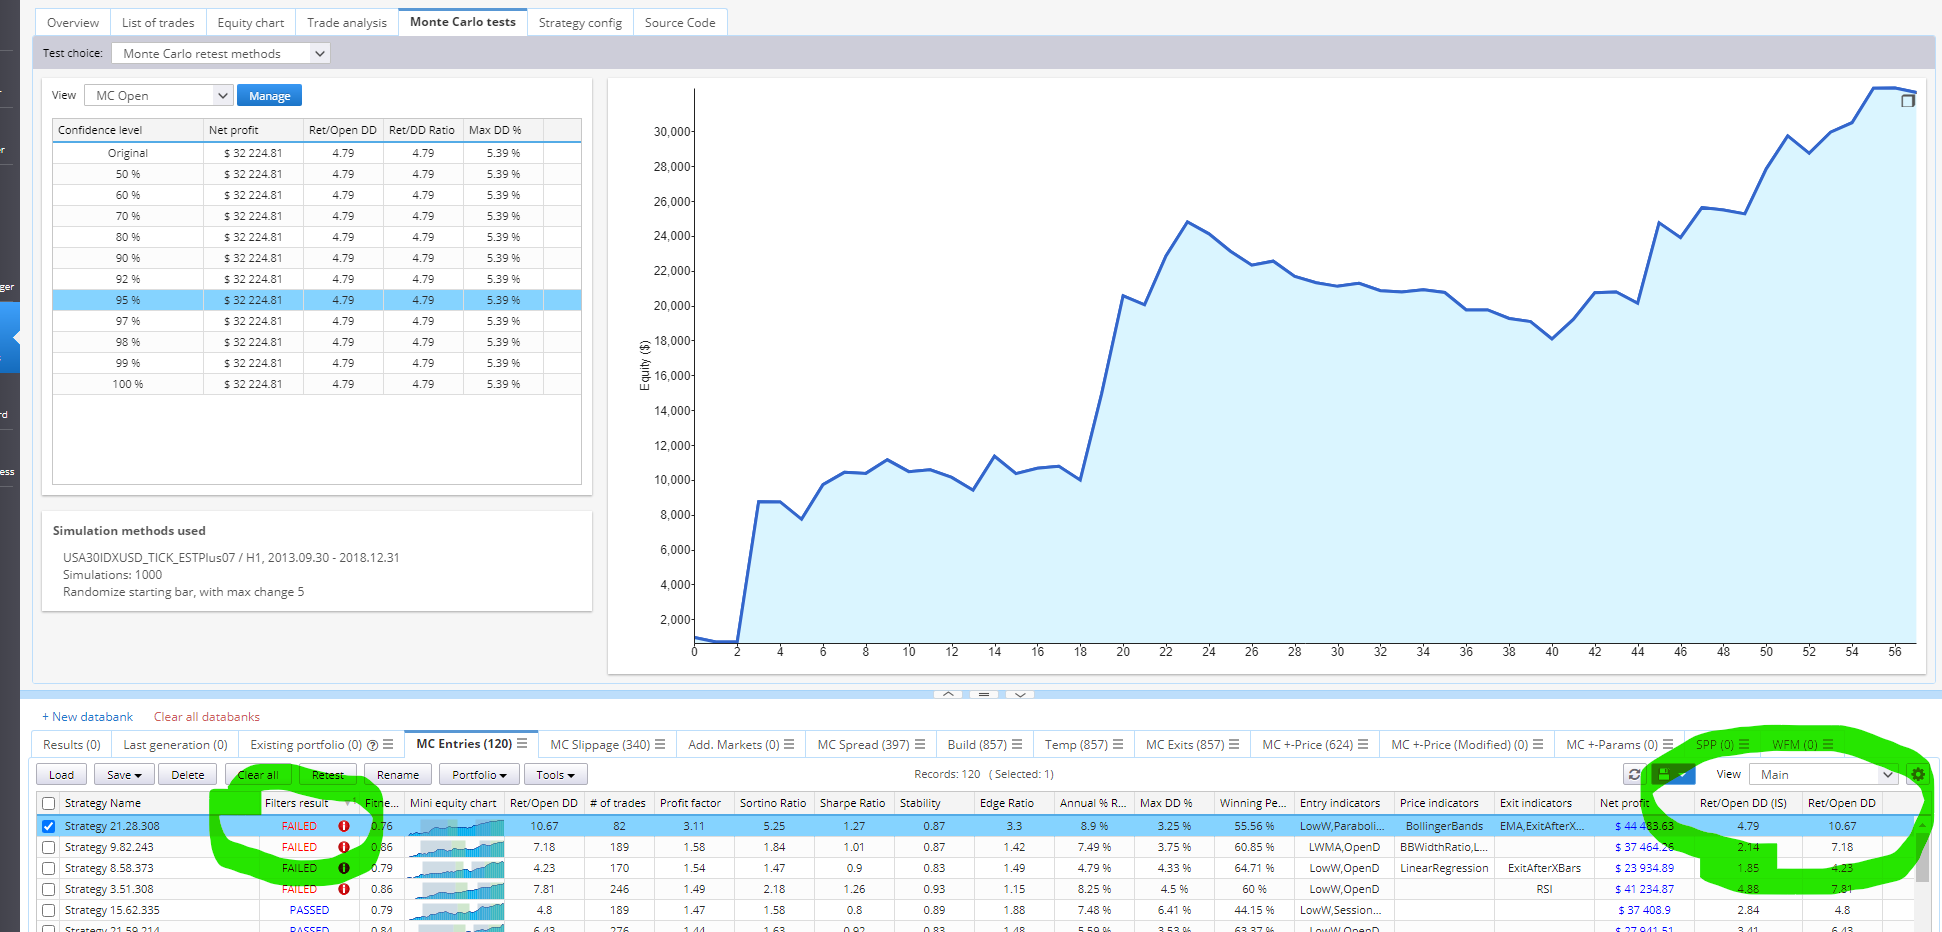
When looking at MC retest graphs and statistics in the results tab, they are only showed for the IS performance and do not take into account the OOS performance. There is no option in the 'Manage Views' tab to change this for IS/OOS/Full the same way that there is in the strategy view tab for the databanks, meaning that it is impossible to see a graph of the full MC results.
However, the CrossCheck filter works on the full IS + OSS data. This means that a strategy may be filtered but you are unable to see why, as you can only see the IS visualisation and statistics on the results tab.
For those that like to qualitatively look at MC graphs this is quite misleading. An option in the view tab for the MC statistics to work on Full/IS/OOS data would be useful, as would an option in the MC Retest crosscheck filter to specify whether to apply the filter to the full data (as it is already), or just the IS/OOS portions, similar to how it works for other ranking filters in the rest of the program.
-
Votes +3
-
Project StrategyQuant X
-
Type Feature
-
Status New
-
Priority Normal
History
Goon
20.07.2021 19:22Attachment image-2.png added
Attachment image-3.png added
Attachment example_broken_MC_retest.sqx added


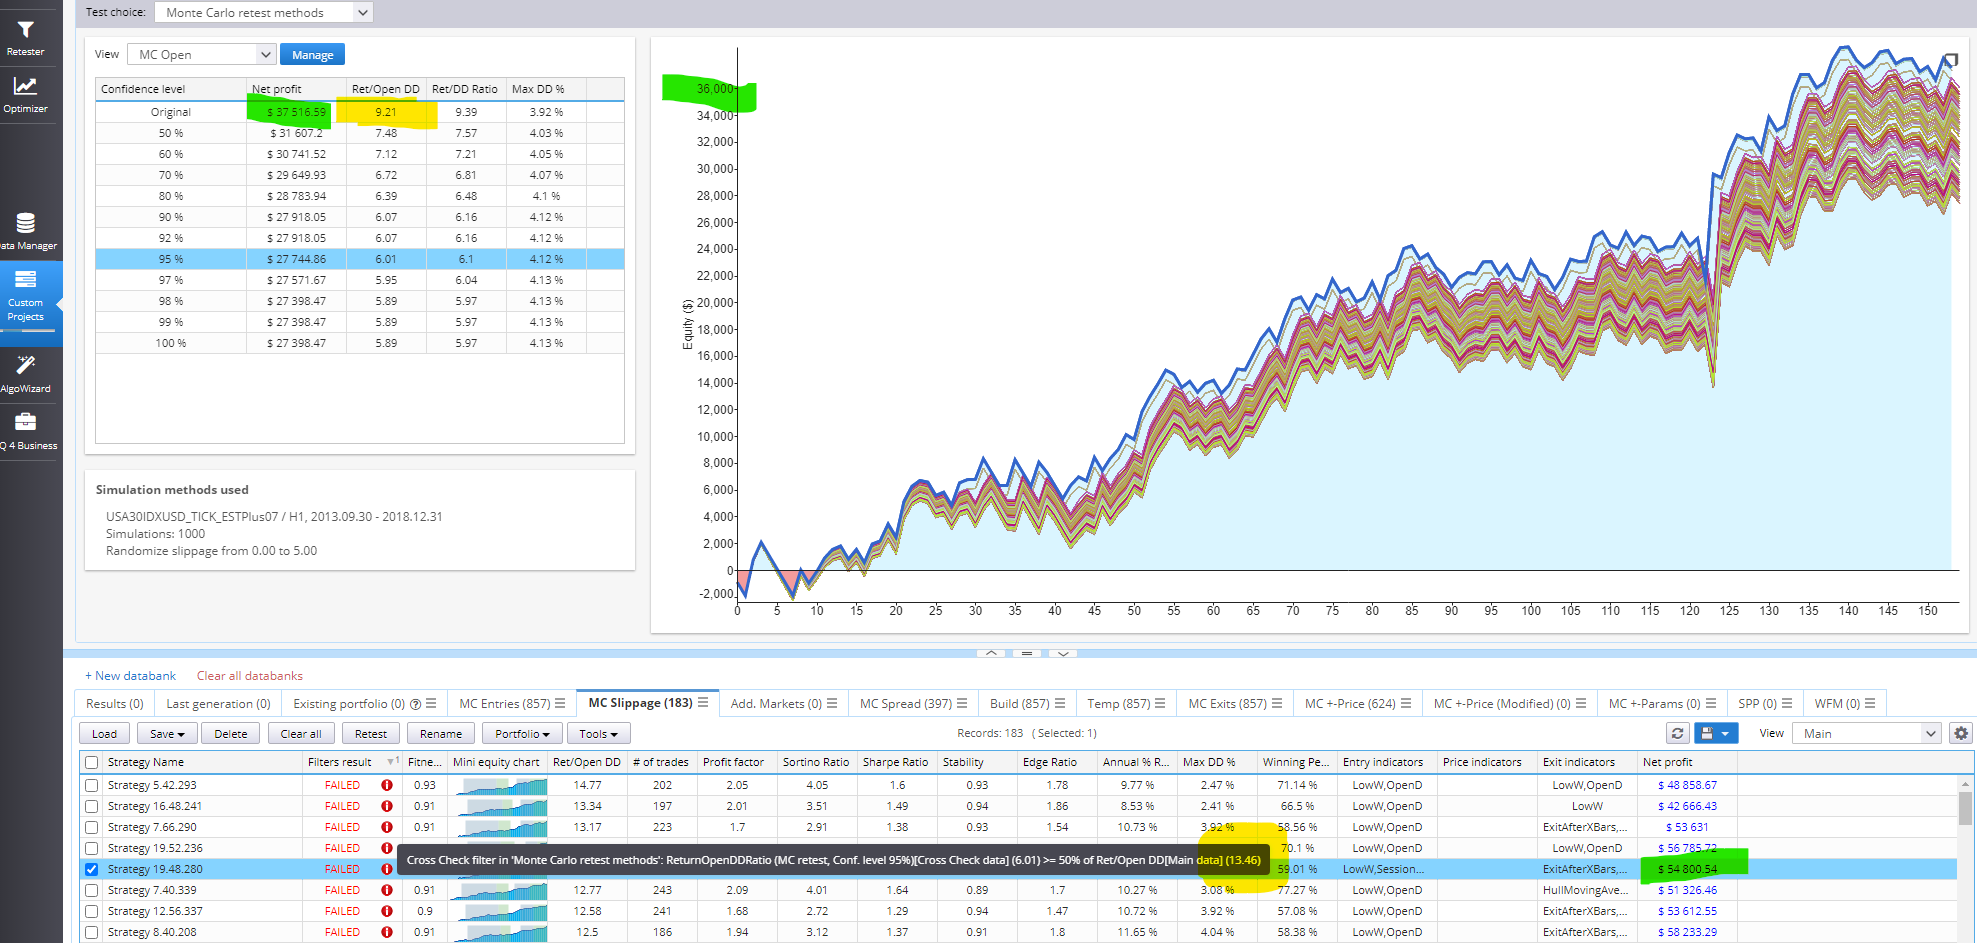
Actually, on further inspection - THIS IS A BUG
The MC Retest CrossCheck filter mixes IS + OOS
When comparing, for example:
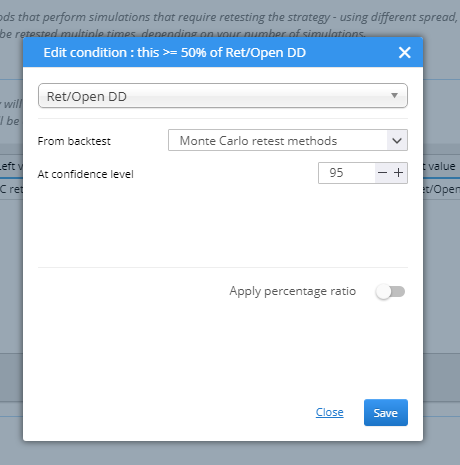
MC Retest 95% Ret/DD > 50% Ret/DD
It uses the IS+OOS result of the 95% Ret/DD, with only the IS original strategy metric.
This means that, you can run a MC retest without changing anything at all (and so the visualisation is a single line, shown below) and still fail the crosscheck, if your original strategy IS results do not pass the filters when compared to the IS+OOS original strategy result.
bentra
20.07.2021 20:09Goon
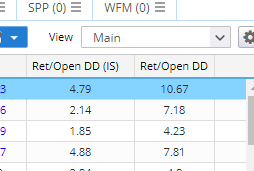
20.07.2021 20:21I did not have 'Use Full Sample' checked, and so I was only comparing the IS MC result to the Full Sample original strategy, hence why it could fail without having changed anything in MC as it was just comparing IS to OOS.
This task can be deleted. Thank you Bentra!
© Copyright. All rights reserved. ProjectPanel.com
