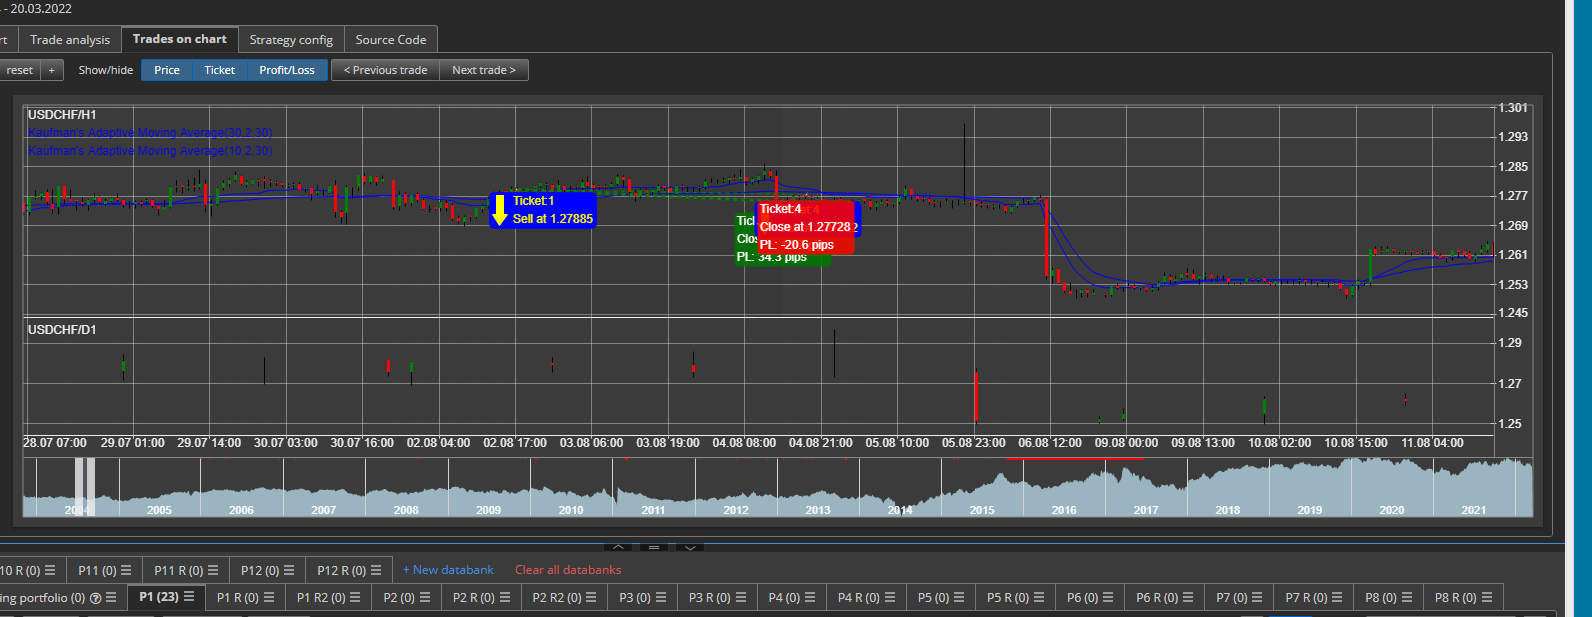
Trades on Chart : Could we select the indicator color ? and the data Series
1/ As you can see we , it is very difficult to see which indicator is which indicator ? Both curve have the same color : Blue
Could we select the indicator color ?
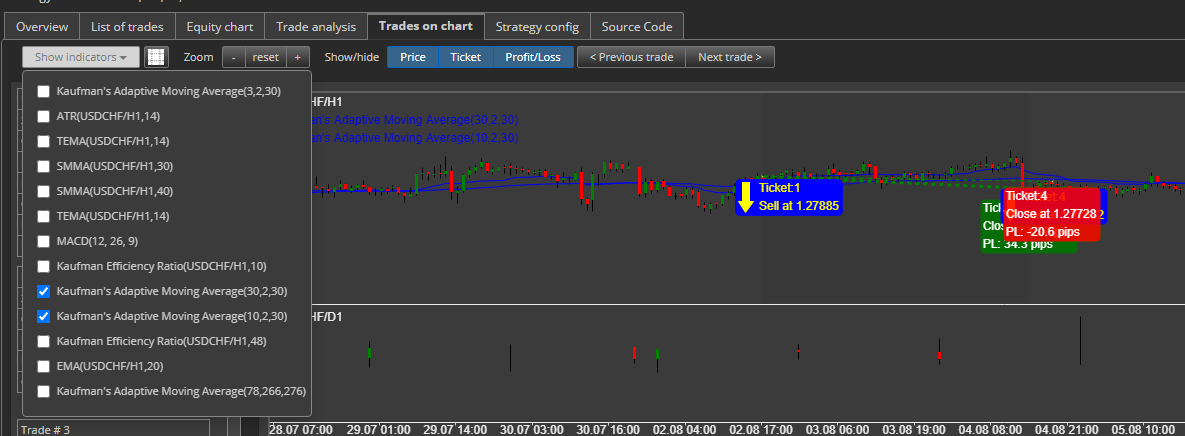
2/ Could we add manually an indicator ? selecting the data series , color , etc. ?
Only random indicator of the template will appear on the graph : If your template have for example a fix long filter : > SMA 200 . as it is not random. the indicator will not appear on the graph.
This is why we need to be able to add manually indicator to be able to see our filter, and to check our indicator and signal
3/ If you are using a second data series (D1 in this charts), we need to be able to activate or deactivate as an option because we don't always need it on the graph. (On this graph, we don't need it)


-
Votes +1
-
Project StrategyQuant X
-
Type Feature
-
Status New
-
Priority Normal
History
Emmanuel
28.03.2022 12:14Description changed:
1/ As you can see we , it is very difficult to see which indicator is which indicator ? Both curve have the same color : Blue
Could we select the indicator color ?
2/ Could we add manually an indicator ? selecting the data series , color , etc. ?
Only random indicator of the template will appear on the graph : If your template have for example a fix long filter : > SMA 200 . as it is not random. the indicator will not appear on the graph.
This is why we need to be able to add manually indicator to be able to see our filter, and to check our indicator and signal
3/ If you are using a second data series (D1 in this charts), we need to be able to activate or deactivate as an option because we don't always need it on the graph. (On this graph, we don't need it)
© Copyright. All rights reserved. ProjectPanel.com
