[Building Block] Using R-Squard/Geometry as an indicator block?
[Building Block] Using R-Squard/Geometry as an indicator block?
Imagine this:
IF High[84] till High[1] >= 330 ° then Open BUY
IF Low[84] till Low[1] <= 34 ° then Open SELL
or
As a strait range which we already got a block like this already in SQ:
IF High[56] till High[1] >= 360 ° then Open BUY
IF Low[56] till Low[1] <= 360 ° then Open SELL
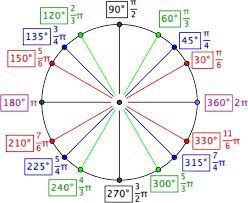
obviously we should focus on 90 ° to 270 ° because we should look at the ride side of the 1/2 of the circle (screenshot)
and a visual screenshot of what's possible
IF High[84] till High[1] >= 330 ° then Open BUY
IF Low[84] till Low[1] <= 34 ° then Open SELL
or
As a strait range which we already got a block like this already in SQ:
IF High[56] till High[1] >= 360 ° then Open BUY
IF Low[56] till Low[1] <= 360 ° then Open SELL
obviously we should focus on 90 ° to 270 ° because we should look at the ride side of the 1/2 of the circle (screenshot)
and a visual screenshot of what's possible
and other examples like that, this will somewhat mimic Manual "Technical Geometrical Analysis"
-
Votes +1
-
Project StrategyQuant X
-
Type Feature
-
Status New
-
Priority Normal
History
k
b
k
Karish
13.06.2022 19:24
@bentra, i hear you mate, i thought about a different method but it seems that we already got it in SQ ^_^
IF High[56] > High[1] && Distance between High[56] and High[1] is >= 200 pips == Open BUY
IF Low[56] < Low[1] && Distance between Low[56] and Low[1] is >= 200 pips == Open SELL
This way we cover the distance in Height (High[56] > High[1] / Low[56] < Low[1])
And we cover the distance in Width (Distance between High[56] and High[1] is >= 200 pips)
Not sure if it can generate these rules right now, but its super possible, maybe we can already generate such a building block with a custom block builder in AlgoWizard?.., hmmm
b
bentra
13.06.2022 21:43
Yes, that could be a good alternative for a custom block or a template.
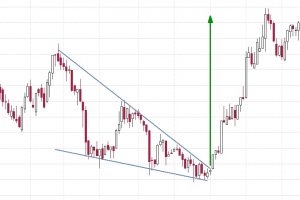
Just to clarify though, your image shows a couple of nice trendlines that only touch the highs of some bars and another that touches the lows of some bars but in your mathematical solution this would not be the case necessarily, in many cases drawing a line from high[56] to high[1] will penetrate other bars through the middle. It doesn't mean your solution is not useful, it just means it won't usually be a nice trendline like in the picture.
Just to clarify though, your image shows a couple of nice trendlines that only touch the highs of some bars and another that touches the lows of some bars but in your mathematical solution this would not be the case necessarily, in many cases drawing a line from high[56] to high[1] will penetrate other bars through the middle. It doesn't mean your solution is not useful, it just means it won't usually be a nice trendline like in the picture.
k
E
Votes: +1
© Copyright. All rights reserved. ProjectPanel.com

Even harder to program is the trendline detection itself. I submitted a functioning (albeit terribly ugly and confusing - I wrote it in 2008) mql code that detects trendlines to do simple trendline break signals but it was deemed too complicated.... also it is very cpu intensive. Assuming you want to make sure the line drawn does not penetrate other bars which it will most of the time if just choose high of bar 56 to current bars high.