Strategy Results , Equity Chart do not have Swap cost
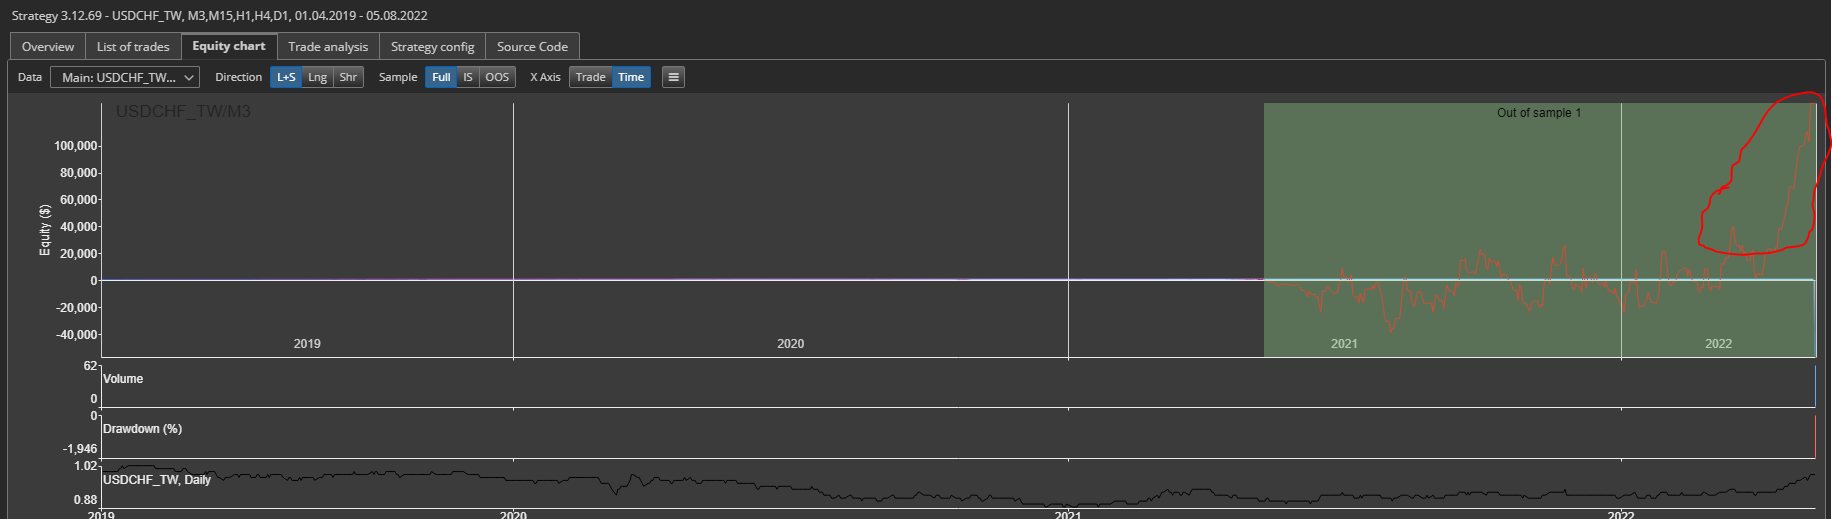
For example, as you can see on the attached chart, the Equity seem to be profitable at the end of 2022
but the strategy won't exit the trade because the real Net profit is in Loss
The Equity Chart is misleading without the Swap cost and commission
We can not see without the swap and commission where the the trade could exit on the chart
Please include the Commission and Swap Cost in the Equity curve
-
Votes +2
-
Project StrategyQuant X
-
Type Bug
-
Status Refused
-
Priority Normal
History
Tamas
11.11.2022 09:33Status changed from New to Refused
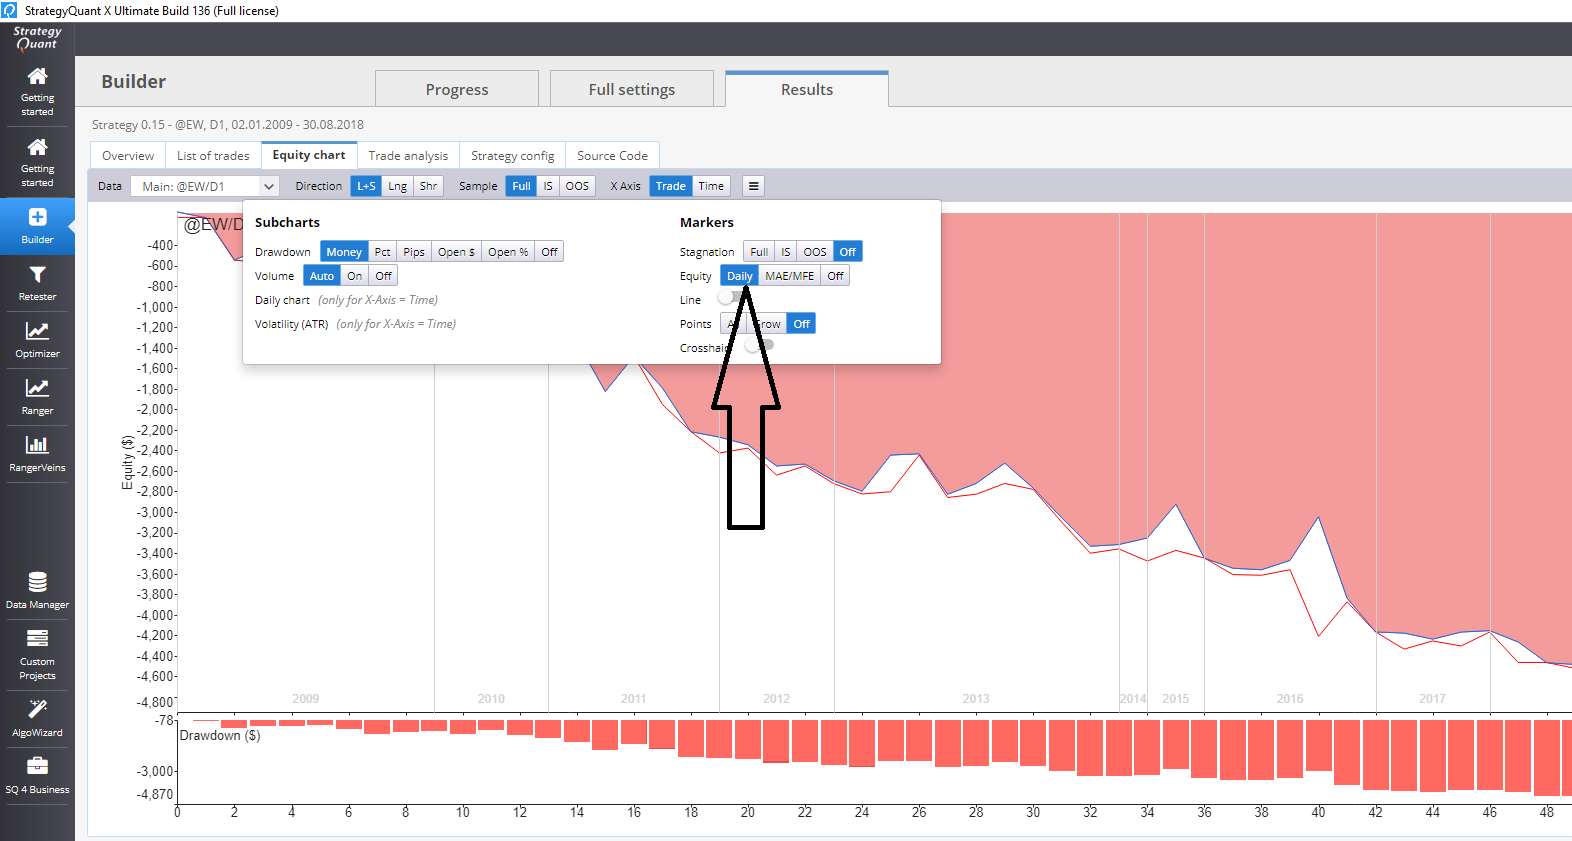
Please check if Comm/Swap is calculated in your case correctly. Go to Results->Trade list and add column Comm/Swap as you can see on my printscreen.
Equity chart is calculated from the values displayed on Results->Trade list / ProfitLoss column.
Please let me know if anything is not clear.
Emmanuel
11.11.2022 13:02Hello Tamas,
No , equity chart does not include swap and commission
How would it be possible ?
SQX equity chart calculus is based on open trades, and open trade calculus does not include the commission or swap cost.
The swap cost and the commission trade is added only when the trade is closed
(we can read it in the java code, the open trade do not have the commission or swap included, it is calculated only when the trade is closed)
I know it because I had to create Open PL function including the swap cost , furthermore this was confirm in our coding session
Tamas
11.11.2022 13:29
Maybe do you mean "Daily Equity" feature on context menu ?
Emmanuel
11.11.2022 13:55On the chart; (above) , we can see the equity is in profit and the strategy keeping the trade open because the trade was in loss in reality with its swap cost
© Copyright. All rights reserved. ProjectPanel.com
