about Portfolio OOS years computing
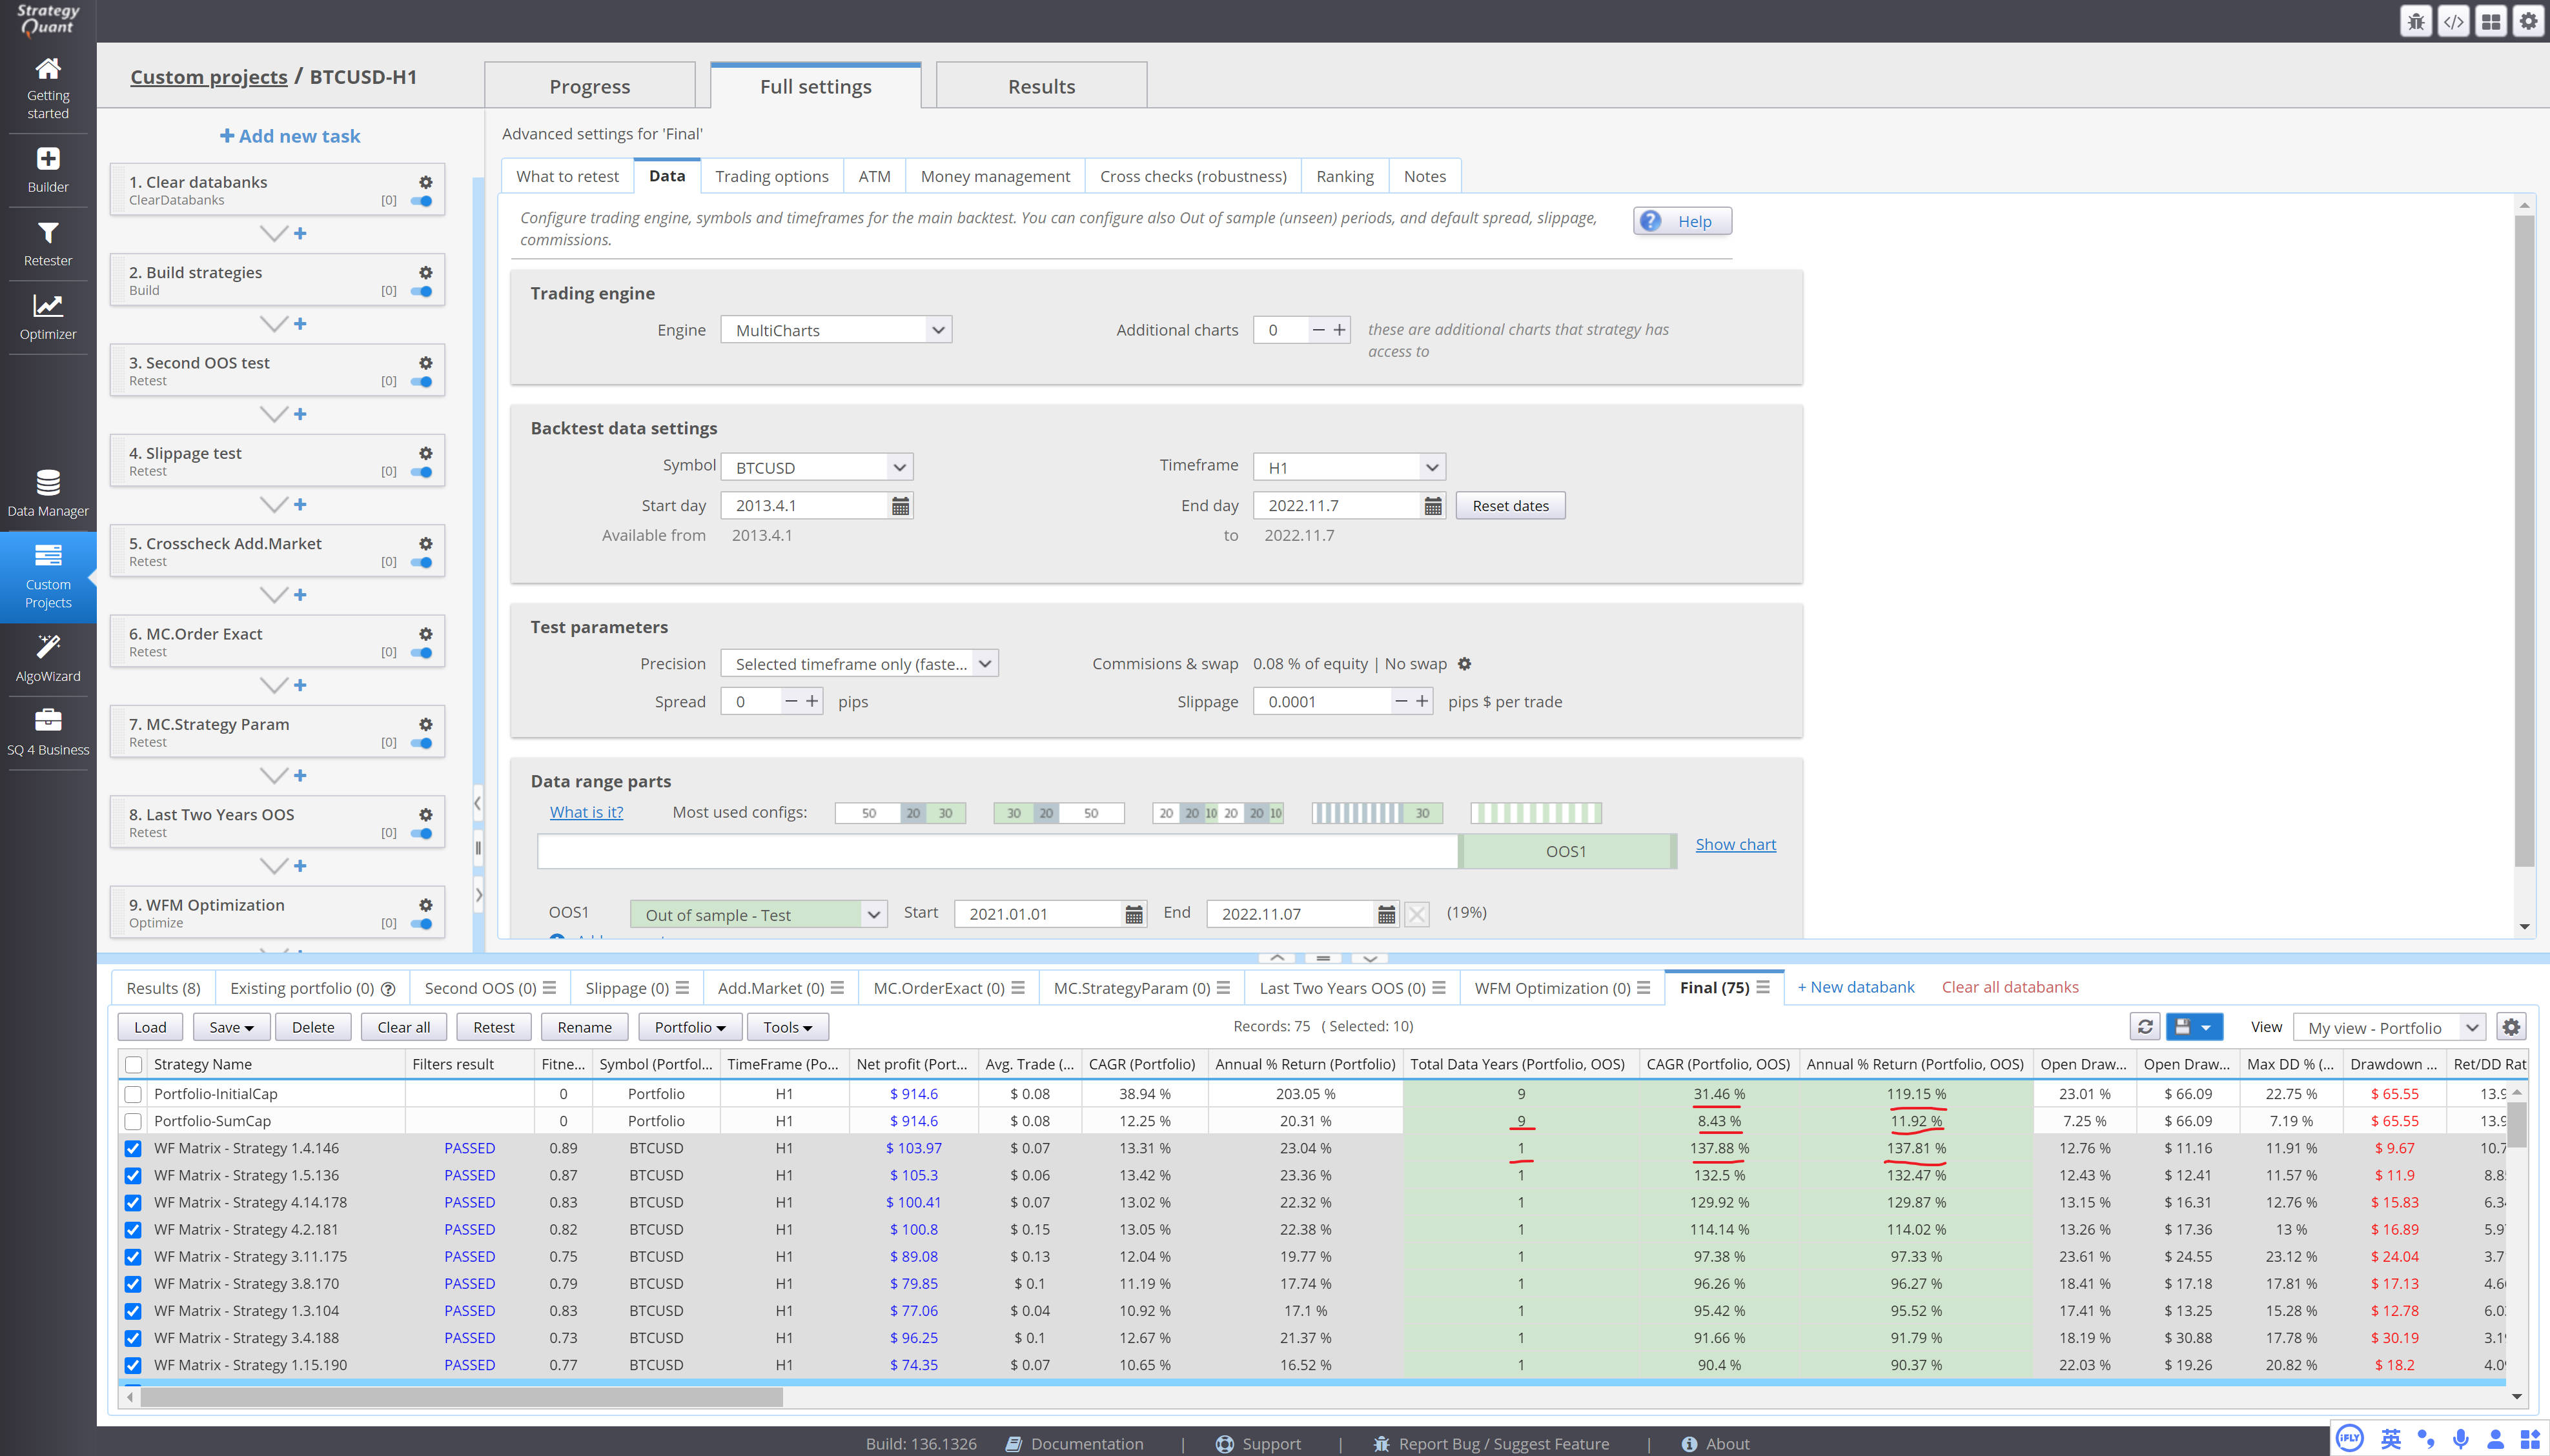
1.The number of years for the portfolio strategy OOS appears to be miscalculated as the number of years for the entire sample.
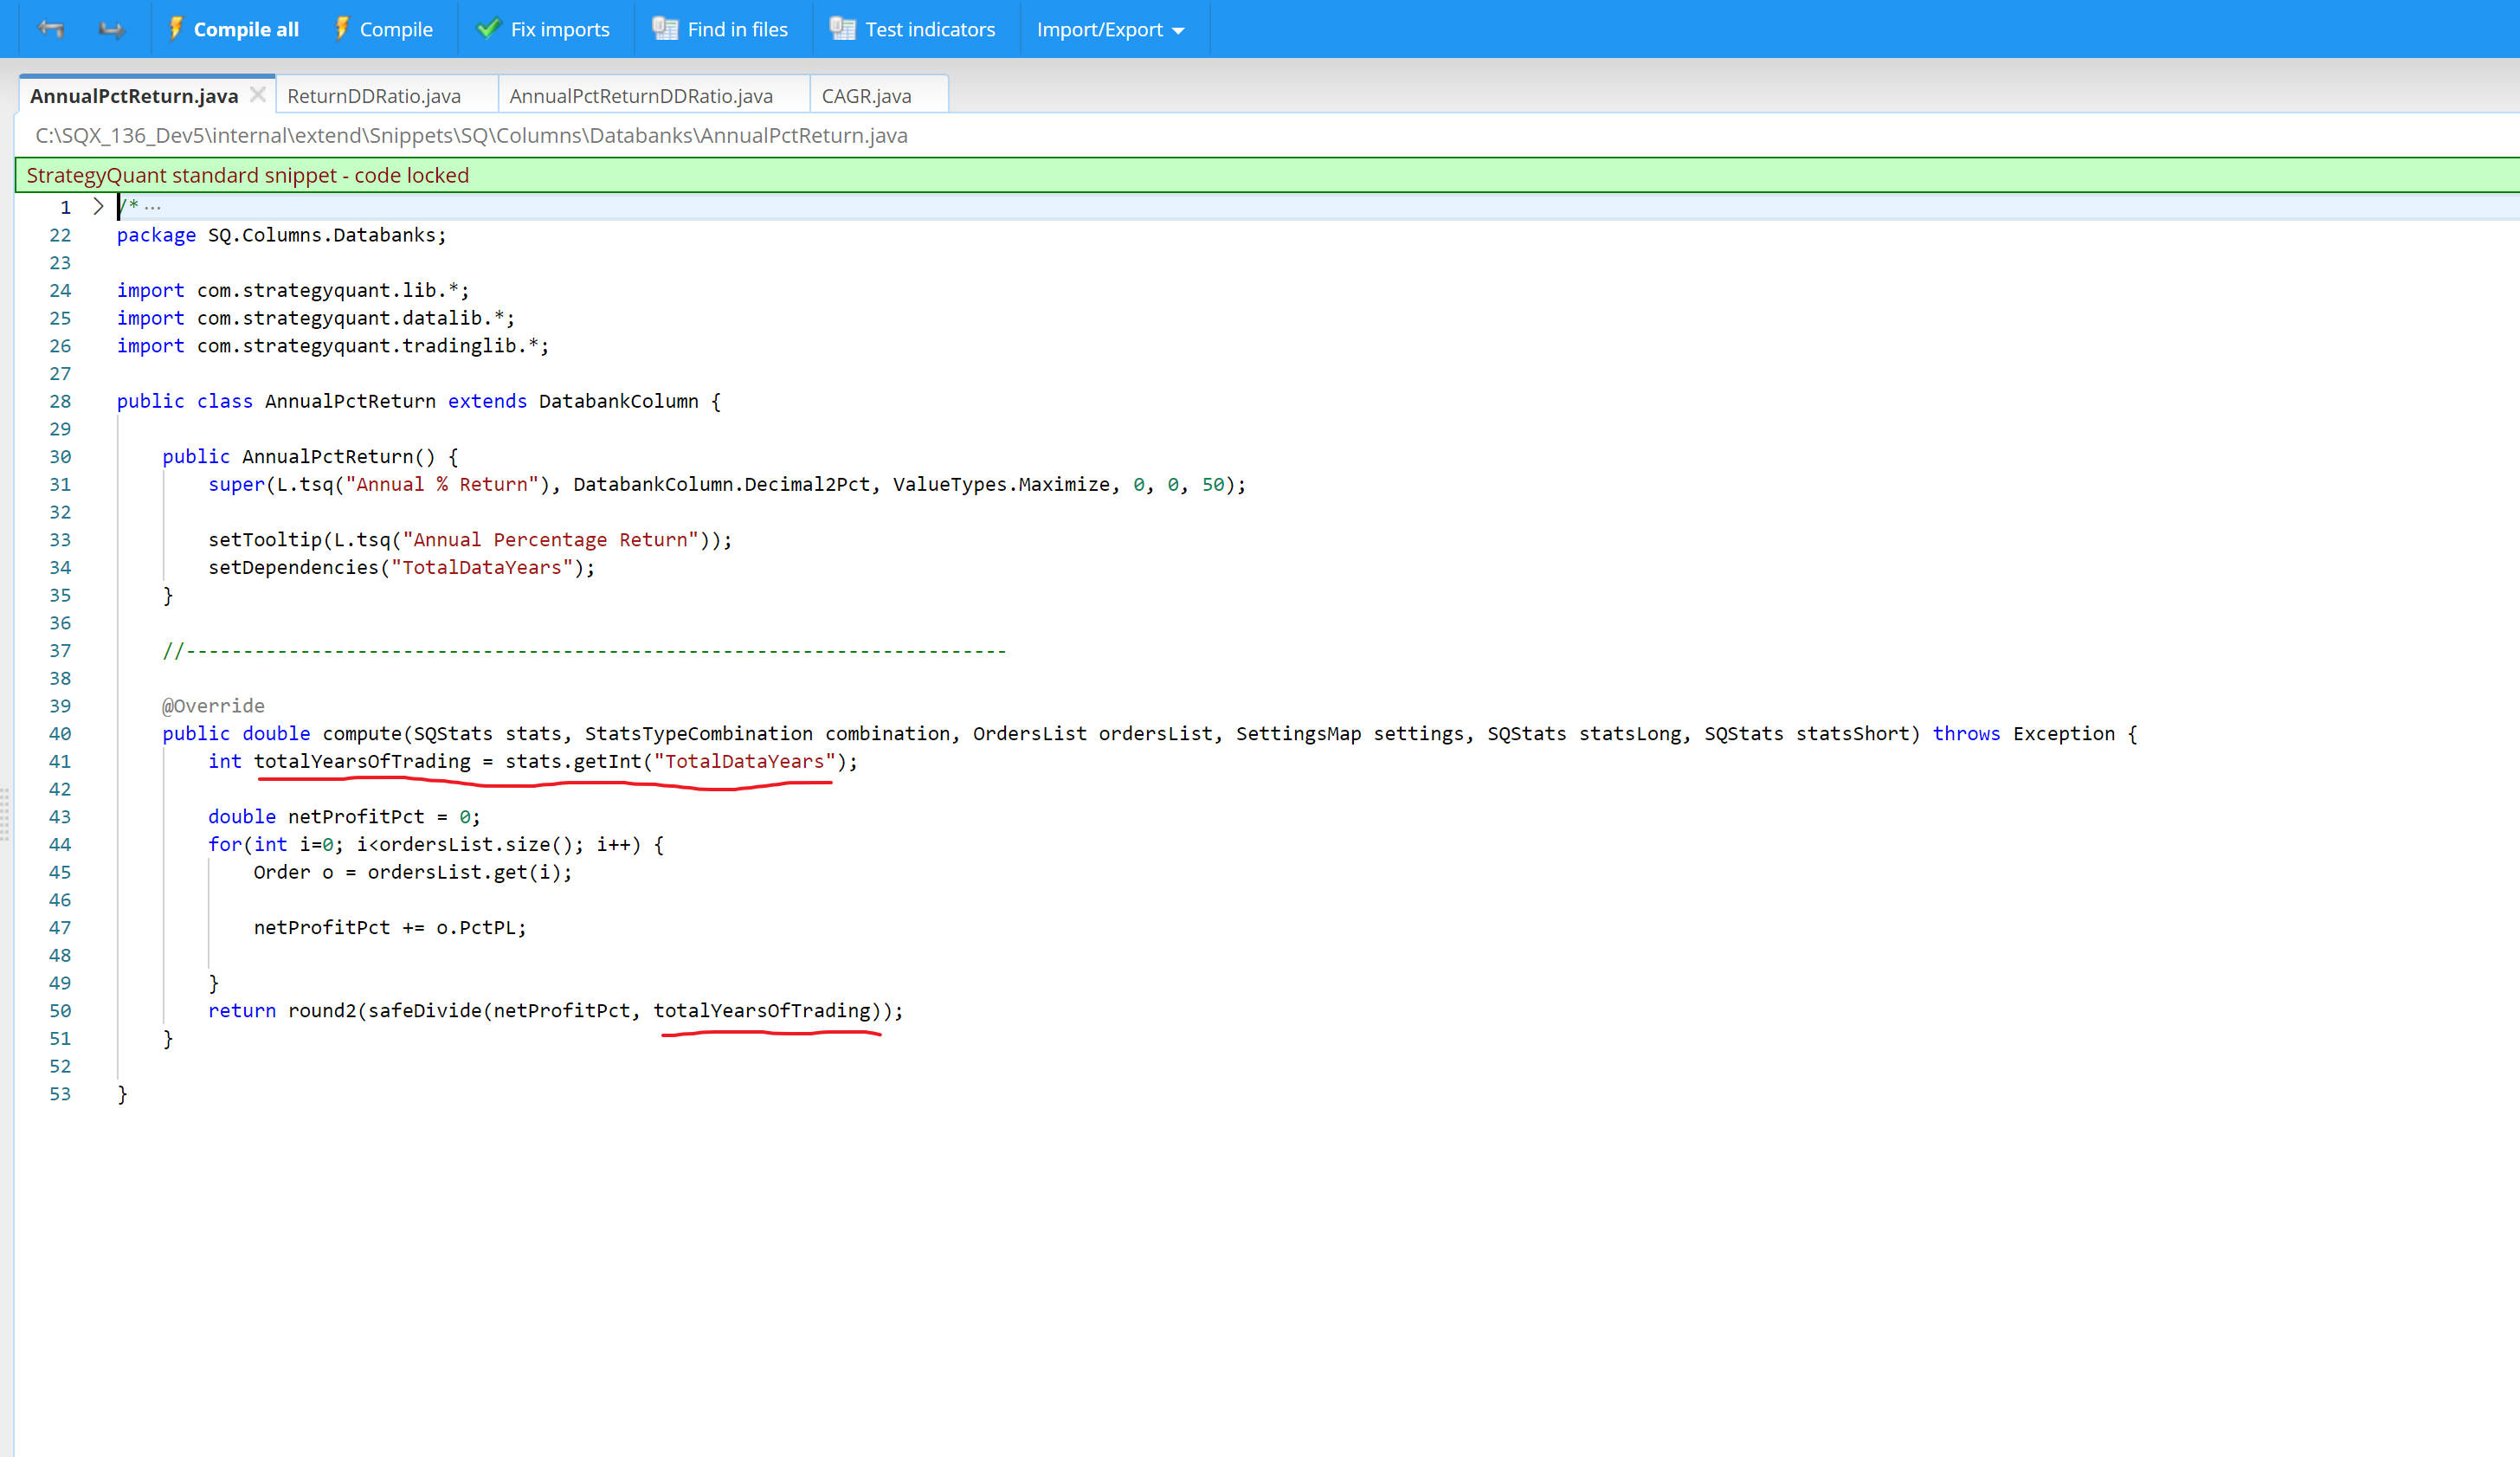
2. As you can see in the attachment, the amount of single strategy OOS data I selected is one year, 10 months and 7 days. but total data years of SQX is 1 year. the calculation in the code is based on total data years, not total trading years.This leads to great errors in calculating the annualized rate of return and CAGR.
3.I think CAGR and the annualized rate of return should be calculated accurately according to total trading month or day, and then converted into annualized. Just like the calculation of the Sharp ratio is also in this way. I think this calculation is more accurate and convincing.
This phenomenon is easy to reproduce, so I will not upload the strategy. As we all know, building a portfolio with low correlation is the closest thing to a free lunch.It is strongly recommended that defects related to portfolio be fixed and related features as soon as possible.
-
Votes +4
-
Project StrategyQuant X
-
Type Bug
-
Status New
-
Priority Normal
History

binhsir
19.11.2022 01:58Description changed:
1.The number of years for the portfolio strategy OOS appears to be miscalculated as the number of years for the entire sample.
2. As you can see in the attachment, the amount of single strategy OOS data I selected is one year, 10 months and 7 days. but total data years of SQX is 1 year. the calculation in the code is based on total data years, not total trading years.This leads to great errors in calculating the annualized rate of return and CAGR.
3.I think CAGR and the annualized rate of return should be calculated accurately according to total trading month or day, and then converted into annualized. Just like the calculation of the Sharp ratio is also in this way. I think this calculation is more accurate and convincing.
This phenomenon is easy to reproduce, so I will not upload the strategy. As we all know, building a portfolio with low correlation is the closest thing to a free lunch.It is strongly recommended that defects related to portfolio be fixed and related features as soon as possible.
© Copyright. All rights reserved. ProjectPanel.com
