[BUG] TS Robustness Index (TradeStation Robustness Index) Addon should be native inside SQX too.. (The Addon wont work with WF results..)
https://strategyquant.com/codebase/robusteness-index-tradestation/
-
Votes +2
-
Project StrategyQuant X
-
Type Feature
-
Status New
-
Priority Normal
History
Karish
16.12.2022 04:57Karish
27.12.2022 03:37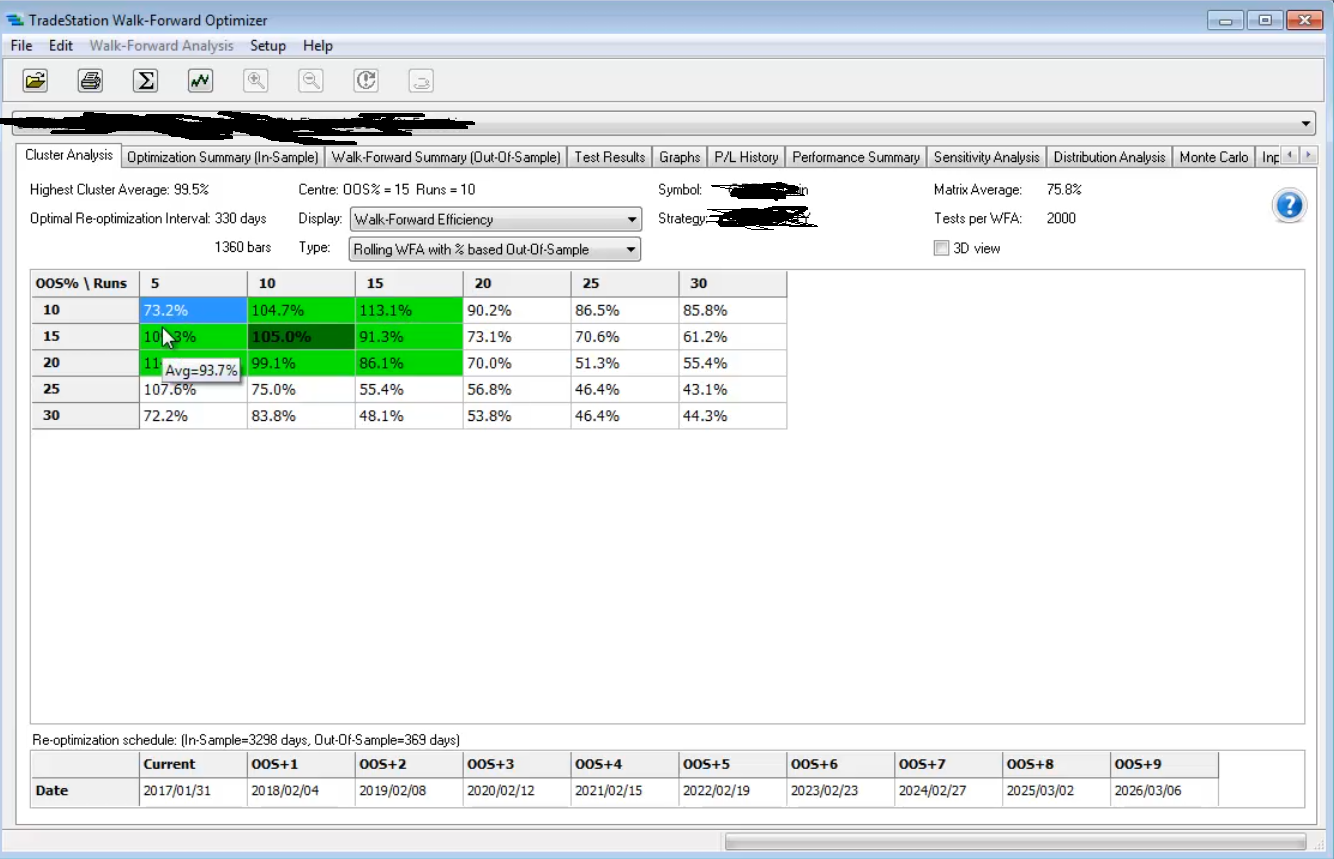
Here is a screenshot of the TS's WFM,
You can use the WalkForward Efficiency metric aka Robustness Index inside the WF cluster inside TS..
(OOS Profit * 365 / number of OOS days) / (IS Profit * 365 / number of IS days) * 100
Walk-Forward Efficiency
WFE Is the ratio of the annualized OOS profit over the annualized IS profit. Some performance deterioration is expected when applying the strategy to OOS data. An efficiency of 100% shows us that OOS results are as good as the IS results. A minimum efficiency of 50% is often used as a passing criterion.
at the attached screenshot there is a way to see the AVERAGE WFE of all the OOSs of WF runs, not only to see the final PASS/FAILED results,
this would be a good feature aswell,
not only as a workable and filterable databank metric, but to use it as an Avg WFE of all the OOSs of the WF run,
thanks.
© Copyright. All rights reserved. ProjectPanel.com
