[Build 106 (Release Candidate 6)] Does OOS work in Builder or is data or data import bad or usage of the same bad before 2013
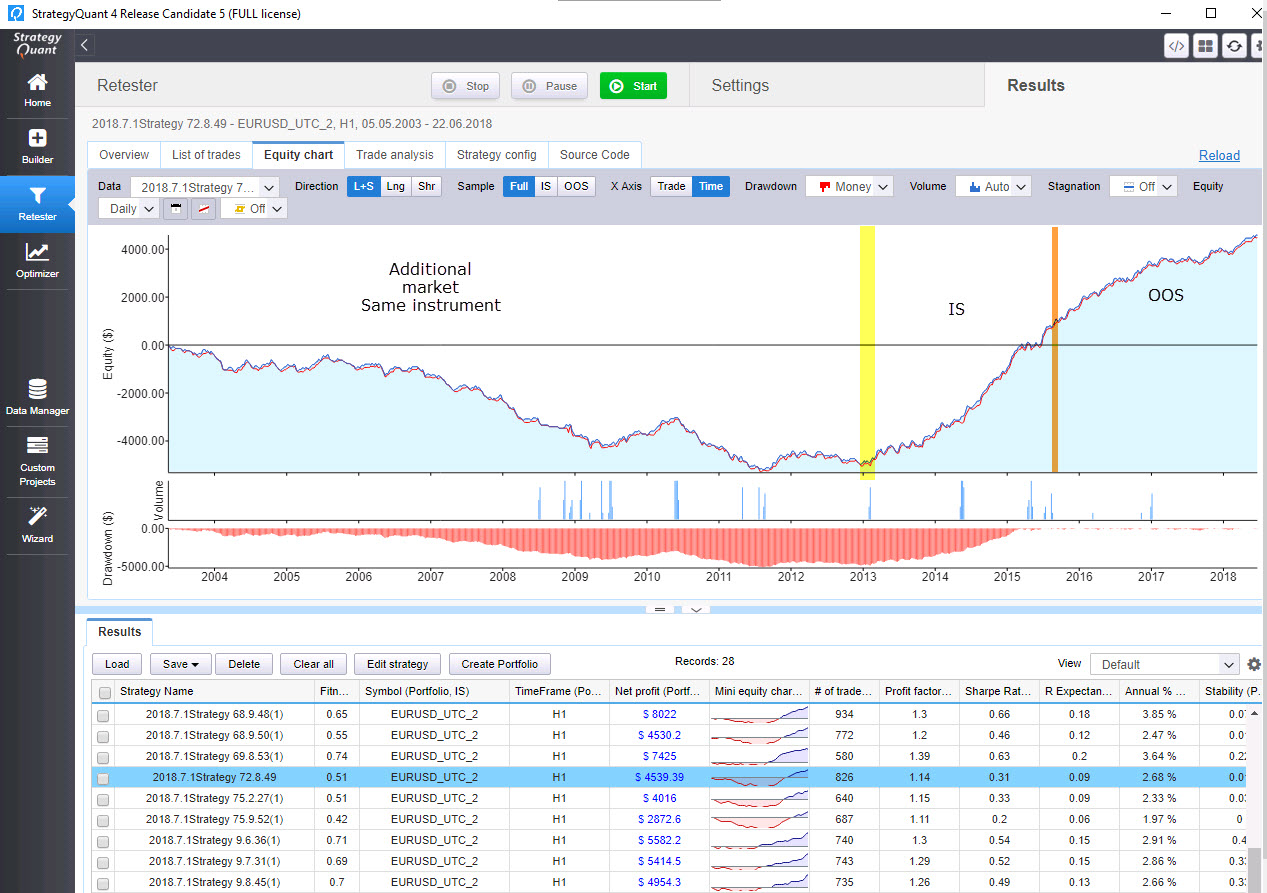
I have been building on data 2013 and forward since that was supplied by default with SQ4. However on most instruments the result before 2013 is usually horrible either almost no trades or flat or loosing. Out of millions that passed IS and OOS including WFA only a handfull is profitable 2003-2013. So i broke out the 2003-2013 and put this on additional markets and with the exeption of a handful strategies of about 2 million generated they all look like attached. Another reason for me to think that something is wrong is beacuse if i add to addtional markets same period 7 instruments 2013-2018 my data banks quickly fills up with strategies that passed 2013-2018 on all additional instruments but they fail badly on 2003-2013.

-
Votes 0
-
Project StrategyQuant X
-
Type Bug
-
Status Refused
-
Priority Normal
History
m
m
mabi
05.07.2018 00:42
I have not seen any big diffrence in strategies between 2007-2013 and 2013-2017 in SQ3 there was not a big change in the market behavior that i am aware of so thats why i think that the OOS function in SQ4 does not work.
m
mabi
05.07.2018 00:53
Failure rate is the same building without OOS on additional markets when re-testing on 2003-2013 . If OOS works on SQ4 i suppose the learning is that a 2-3 year OOS has non what so ever impact on future performance neither have WFA or Montecarlo.
m
mabi
05.07.2018 01:03
This also brings up that the most important feature is actually additional markets and the possebility to set another data period then the original build. Since it is no use testing on additional markets fro the same period of data since they are to correlated ( obviosly)
m
mabi
05.07.2018 01:28
Also doing the OOS in additional markets instead of during build increases the generation speed by 60 -80%
m
mabi
05.07.2018 05:58Attachment Equitychart.jpg added
It seems most all of above is related to me only looking at the EQ charts. When I added colums and values for Additional markets I saw that it is the EQ charts that are not displaying correct data.
m
mabi
05.07.2018 14:05
Take previous post back .. I had changed the IS range without remembering that i did = BUG
MF
Mark Fric
12.07.2018 11:16Status changed from New to Refused
I checked it, but I don't see any error with OOS. It works like this.
It is probably a fact that it is much harder to find strategies that are profitable for 15 years than the ones profitable only for 3 years.
It is probably a fact that it is much harder to find strategies that are profitable for 15 years than the ones profitable only for 3 years.
m
j
jenial
27.07.2018 03:34
I also noticed that any setting I set up for oos is not followed by the softare...it decides at random what oos should be..usually 33%
Votes: 0
© Copyright. All rights reserved. ProjectPanel.com
