Walk Forward Matrix doesn't work in SQX 113
it seems that SQX 113 doesn't calculate properly the equity and the parameters in the Out of Sample periods.
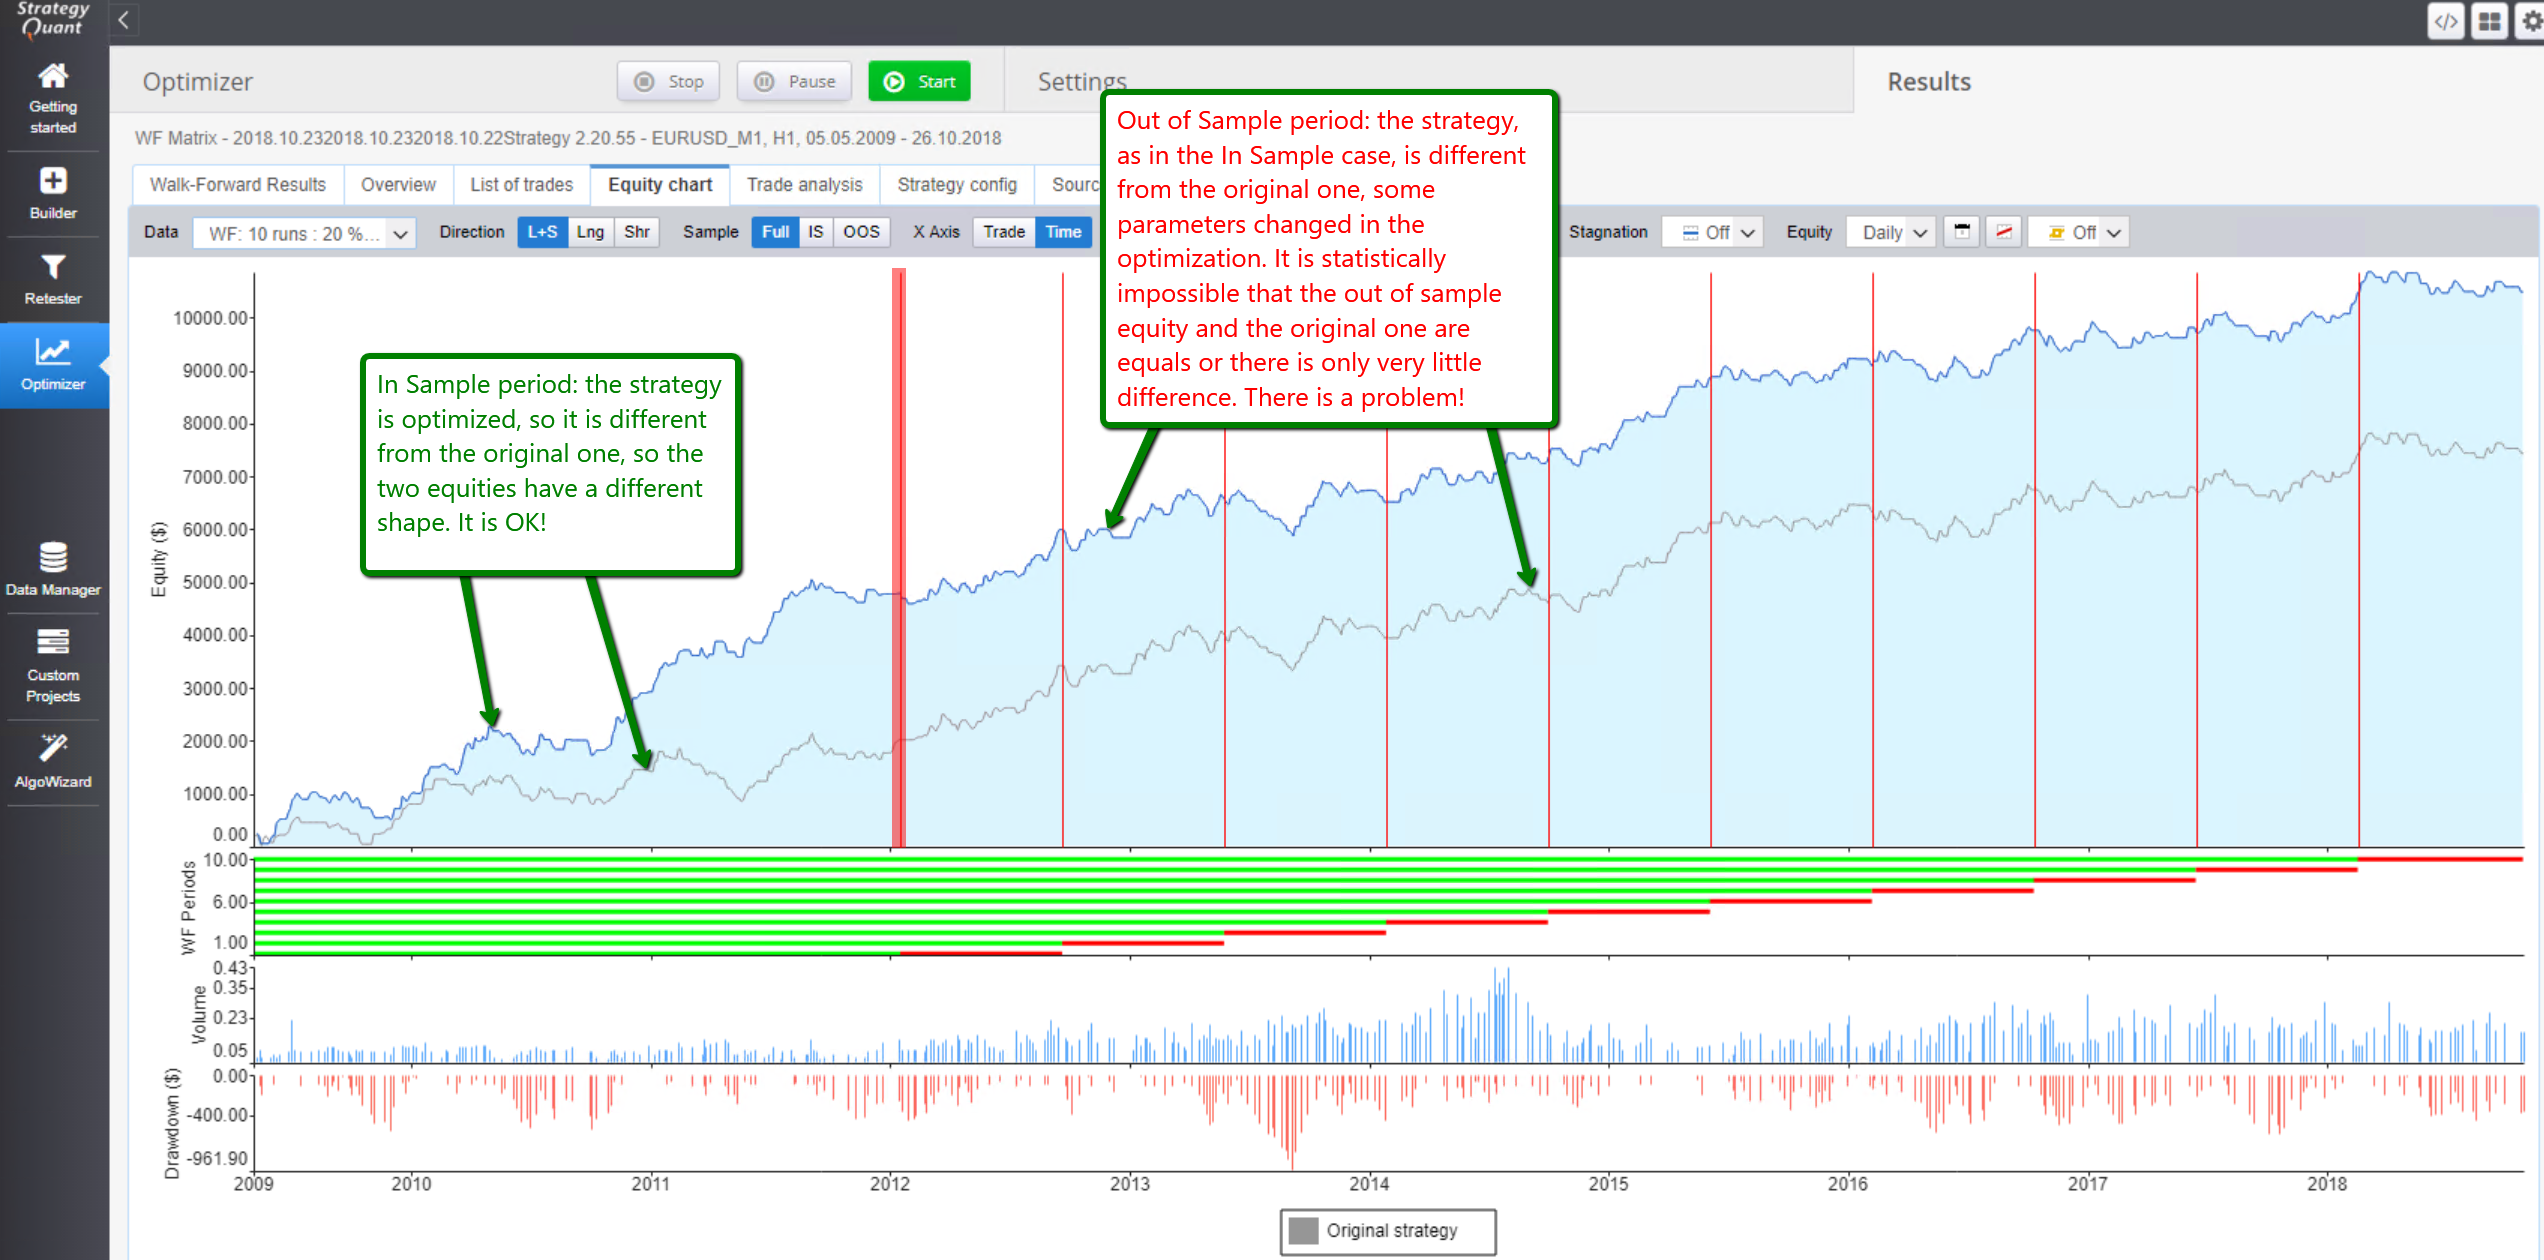
You can see very well this from the equity chart. As you can see in the attached image, in the In Sample period, the optimized strategy has an equity a lot different from the original equity. Instead, in the out of Sample periods the optimized strategies have the same equity as the original one. The two equities should have different shapes, even in the out of sample periods. It is statistically impossible that they are so similar.
I tried with a lot of strategies and with a lot of different configurations, in all the tests there is this problem.
In this way the results are wrong and Walk Forward it is totally unuseful.
I am sure you can promptly solve this problem
ask me If you need more information
thankyou very much
Michele
-
Votes +14
-
Project StrategyQuant X
-
Type Bug
-
Status Fixed
-
Priority Normal
History
bentra
30.10.2018 00:37Interestingly, if you change the default maximum optimizations to something like 1000 from 100, you start to notice small differences is the OOS portions....
bentra
30.10.2018 02:12Michele
30.10.2018 10:11mabi
03.11.2018 22:40Attachment 1.jpg added
Michele
04.11.2018 12:17Yes mabi, it seems that the entire process WF doesn't work. Both equity and parameters are not well calculated.
We are awaiting for the solution for this important task.
WF works fine in SQ3. So i think they are doing it.
Mark Fric
07.11.2018 15:06Does anybody else experience this problem? If yes, could you attach your strategy and Optimizer config?
Michele
07.11.2018 17:06Attachment 2018-11-07_1623.png added
Attachment Strategy 518621.sqx added
Attachment WFA Config.cfx added
Ok Mark, i attach another image of the results of another random strategy. I even attach this strategy and the Optimizer configuration file.
I can't send to you the WFM results file because is bigger than 2MB, but if you need it i could send you it in another way.
In the equity chart select the "Time" mode to see the same equities.
I tried with a lot of different strategies, this problem always happen.
If you need more example let me know.
thanks
Michele
bentra
10.11.2018 12:12Attachment Capture.png added
We are talking about the SHAPE of the equity curve being identical from the point where the first OOS segment begins till the end of the entire sample. Any strategy, any walkforward except as noted above about a few differences explainable by mid trade terminations (or late entries / missed trades) at or near segment borders.
It appears the bug is caused from the code accidentally using the original settings instead of the newly optimized settings for each OOS segment.
bentra
15.11.2018 13:20Attachment Capture_sample.png added
Attachment Optimize_sample.cfx added
Attachment 20181115_sampleStrategy 048885.sqx added
Attachment 20181115_sampleWF Optimization - Strategy 048885.sqx added
I'm still requesting a screenshot of anyone that can produce a walk forward equity line where the OOS of original and OOS of walk forward a clearly using different variable settings because I have yet to produce this or see this!
Mark Fric
15.11.2018 21:14Status changed from New to Fixed
I apologize for this serious eror.
© Copyright. All rights reserved. ProjectPanel.com
