[Build 119] Fitness score not matching actual data values
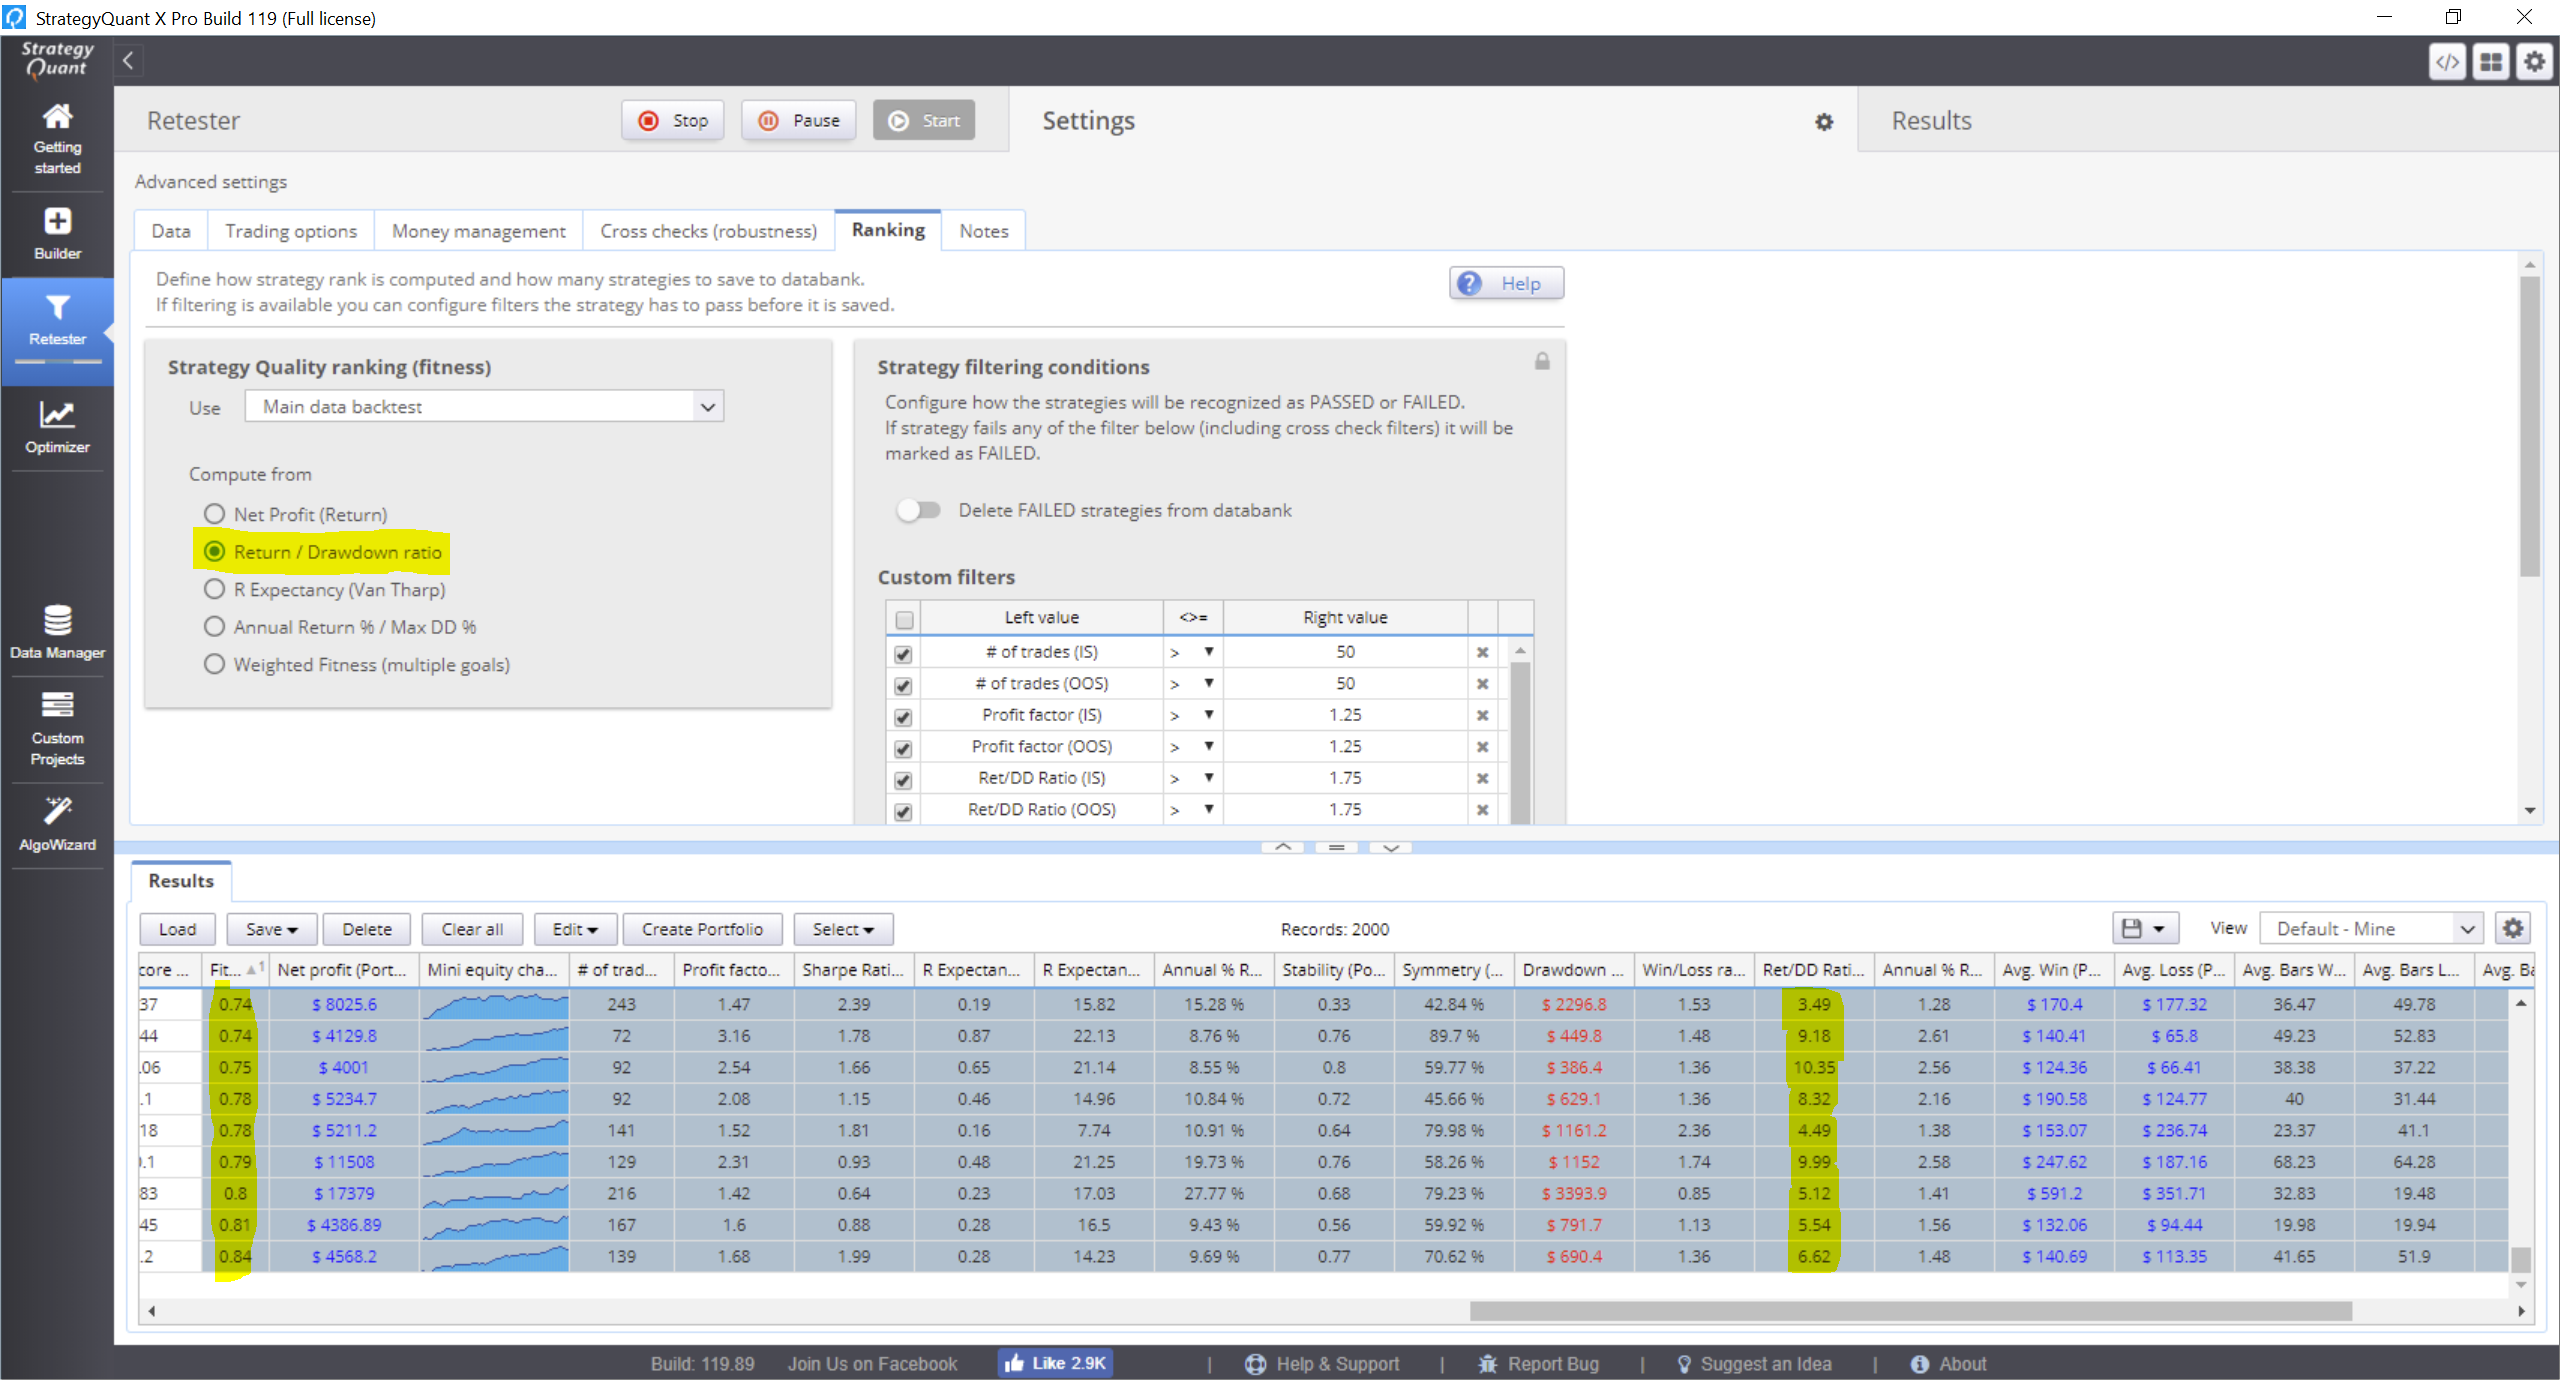
Please see the attached. You'll see I ran this Retest with simply the Return to Drawdown Ratio selected for the fitness function.
In the strategies databank, you'll see I have the data sorted by the OOS Fitness column. Notice that the "Ret/DD Ratio" values are all over the map. Since the "Ret/DD Ratio" was the only factor selected for the fitness function, shouldn't these values in that column be perfectly sorted?
Note - I thought at first this might have something to do with the fact that the fitness function was set to use the "Main Data Backtest", but I don't think this explains anything, since I have the columns sorted by specifically by the Portfolio OOS data, which is also what the Ret/DD Ratio column is representing.
Thank you,
Ryan Hartstein

-
Votes 0
-
Project StrategyQuant X
-
Type Bug
-
Status Refused
-
Priority Normal
History
rhartstein
09.04.2019 09:43Yes, the fitness is transformed. But wouldn't you expect it still to increase in the same direction as the metric that it's mapped to? In this case, I have it set to use the Return to DD ratio. As you can see in the image, the fitness is sorted (ascending) but the Return to DD metric is not sorted at all.
© Copyright. All rights reserved. ProjectPanel.com
