[120]average profit in opt. profile is not collect
please reference the attached file
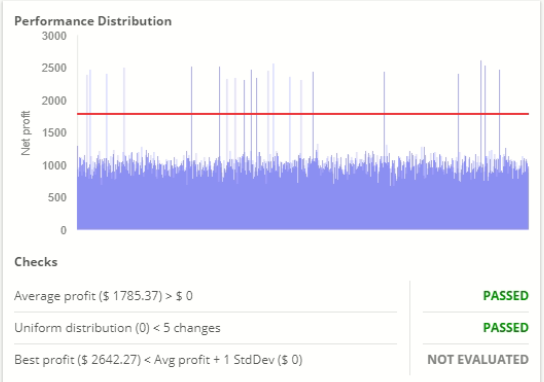
99% is $1000 netprofit observed by the opt. profile
a few strategies is $2500 netprofit
but average is $1785, it's no make sense
i'm not sure if the picture of performance distribution is incorrect( or average profit is incorrect)
please check it
-
Votes 0
-
Project StrategyQuant X
-
Type Bug
-
Status Fixed
-
Priority Normal
History
samuel
13.04.2019 20:36Subject changed from average profit in opt. profile is not collect to [120]average profit in opt. profile is not collect
Tamas
15.04.2019 13:47Status changed from New to Waiting for information
samuel
16.04.2019 04:48samuel
16.04.2019 05:11Attachment Strategy 42163 - Copy.sqx added
samuel
16.04.2019 05:21samuel
16.04.2019 11:11Subject changed from [120]average profit in opt. profile is not collect to [120]average profit in opt. profile is not correct
samuel
16.04.2019 11:16Subject changed from [120]average profit in opt. profile is not correct to [120]average profit in opt. profile is not collect
https://drive.google.com/file/d/1waI35k2rGS70nmHq8v6iocIZ16cCXteD/view
Tamas
16.04.2019 14:31Status changed from Waiting for information to Fixed
Attachment opt profile.jpg added
The problem was in rendering the chart.
© Copyright. All rights reserved. ProjectPanel.com
