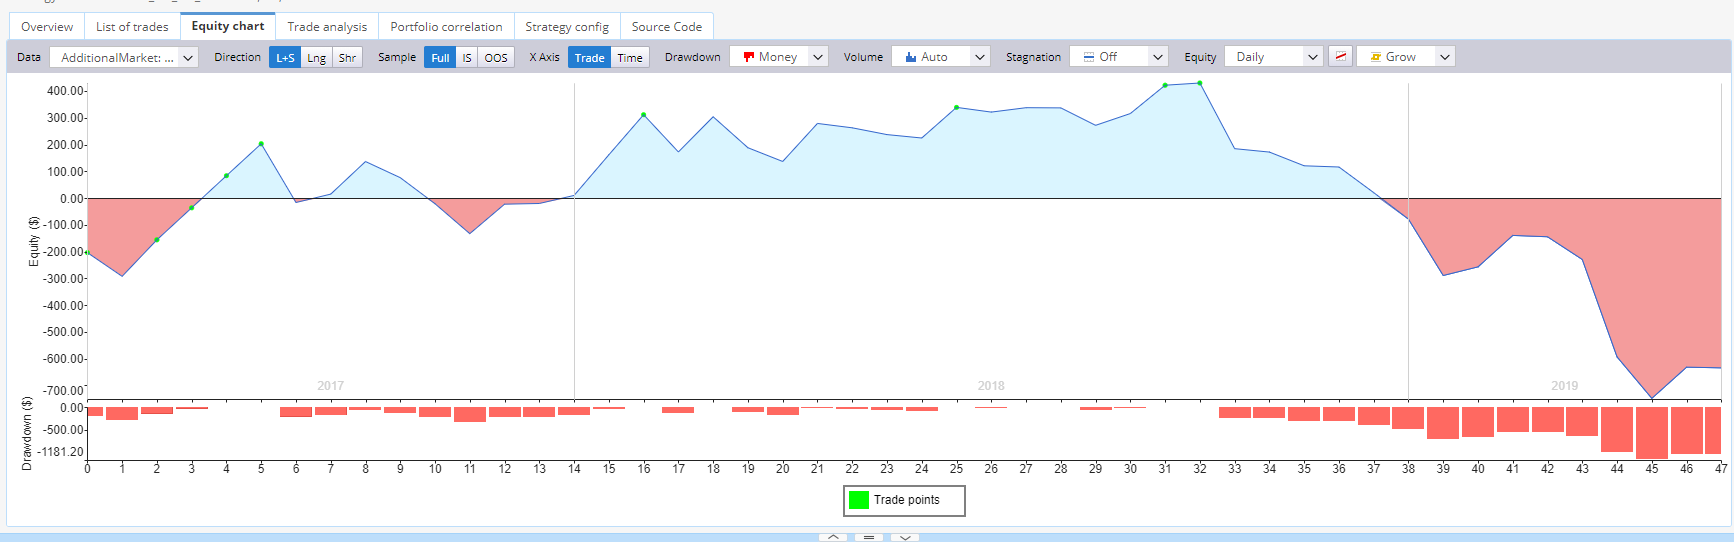
Trade Zero is Trade one needs to be shifted one.
ON a "trades (not time)" chart the 0 trades number axis should be no trades yet and should be plotted at the $0 PL axis. There currently is no equity curve for the first trade because the data is plotted at axis 0 for the first trade. When there are 48 trades, the last number should be 48 not 47. The first trade should be at trades axis 1 but instead the second trade is plotted at trades axis 1.
-
Votes +3
-
Project StrategyQuant X
-
Type Feature
-
Status Refused
-
Priority Low
History
b
b
bentra
21.07.2019 18:32
In "time" mode the chart suffers from similar bug. The first trade has no equity curve. The chart begins at the end of the first trade instead of at $0.
TT
b
b
bentra
27.11.2019 13:12
Feature? Really?
I get that this is low priority and I get that charts can be drawn in different ways and still be correct but why on earth would we want to hide the line the first trade makes from zero? It makes more sense for our PL charts to start at zero and draw a line to the PL of the first trade....
I get that this is low priority and I get that charts can be drawn in different ways and still be correct but why on earth would we want to hide the line the first trade makes from zero? It makes more sense for our PL charts to start at zero and draw a line to the PL of the first trade....
DR
MF
Mark Fric
24.09.2020 13:54Status changed from New to Refused
I'm going to refuse it, it is unimportant feature.
k
Votes: +3
© Copyright. All rights reserved. ProjectPanel.com
