Return to Draw Down Ratio for Portfolio incorrect OR portfolio graph incorrect

How could this be a RT/DD 5+??? (That is portfolio return/dd that we are sorted by in the image showing 5.3)
Attachments
Annotation 2019-07-22 004538.png
(137.25 KiB)
  • Votes 0
  • Project StrategyQuant X
  • Type Bug
  • Status Fixed
  • Priority High

History

b
#1

bentra

22.07.2019 06:48

Task created

h
#2

hankeys

22.07.2019 07:18
in the databank is set to view the values for MAIN DATA not for PORTFOLIO
b
#3

bentra

22.07.2019 07:52

Attachment Annotation 2019-07-22 015041.png added

Thanks for the reply but actually no it is the portfolio. The drawdown in the graph is huge but the drawdown in the report is tiny for some reason....


b
#4

bentra

22.07.2019 08:00
It looks more like it's the portfolio only graph that is wrong. the portfolio parts don't experience drawdowns at those points. Either way, something is afoot.
b
#5

bentra

22.07.2019 08:03

Subject changed from Return to Draw Down Ratio for Portfolio incorrect... to Return to Draw Down Ratio for Portfolio incorrect OR portfolio graph incorrect

b
#6

bentra

22.07.2019 08:10

Attachment Annotation 2019-07-22 020845.png added

To clarify it's a portfolio of cross checks on other markets.
MF
#7

Mark Fric

22.07.2019 14:24

Status changed from New to Waiting for information

can you attach this strategy here? It is difficult to find a problem from an image.
b
#8

bentra

22.07.2019 16:44

Attachment Retest-bugged.cfx added

Attachment bugged-portfolio-line-y 0907.sqx added

This one suffers from similar looking portfolio line
MF
#9

Mark Fric

23.07.2019 10:22
ok, I got it. 

Drawdown % is computed from Initial capital + Net profit.

In case of Portfolio, its Initial capital is the sum of Initial capitals of all its components.


So if each test has initial capital of 10.000, and there are 10 strategies in portfolio, its initial capital will be 10x10.00 = 100.000.

That's why Drawdown % can look big on equity chart, but is small in %.


Making it configurable is a possible low priority feature, I created a task for it: https://roadmap.strategyquant.com/tasks/sq4_5139


MF
#10

Mark Fric

23.07.2019 10:28

Status changed from Waiting for information to Refused

b
#11

bentra

23.07.2019 10:59

Attachment Annotation 2019-07-23 052041.png added

OK that does explain why the percentage drawdown is small but not why the return to drawdown so high, the return and drawdown should be relative. You can easily see with your eyes the return to drawdown for portfolio is being overstated for the first equity chart. I actually think in these scenarios, the return to drawdown is correct but something is wrong with that equity curve for the portfolio, why are the portfolio parts drawing down so little, or even in some spots, not drawing down at all yet the portfolio line is drawing down so much?

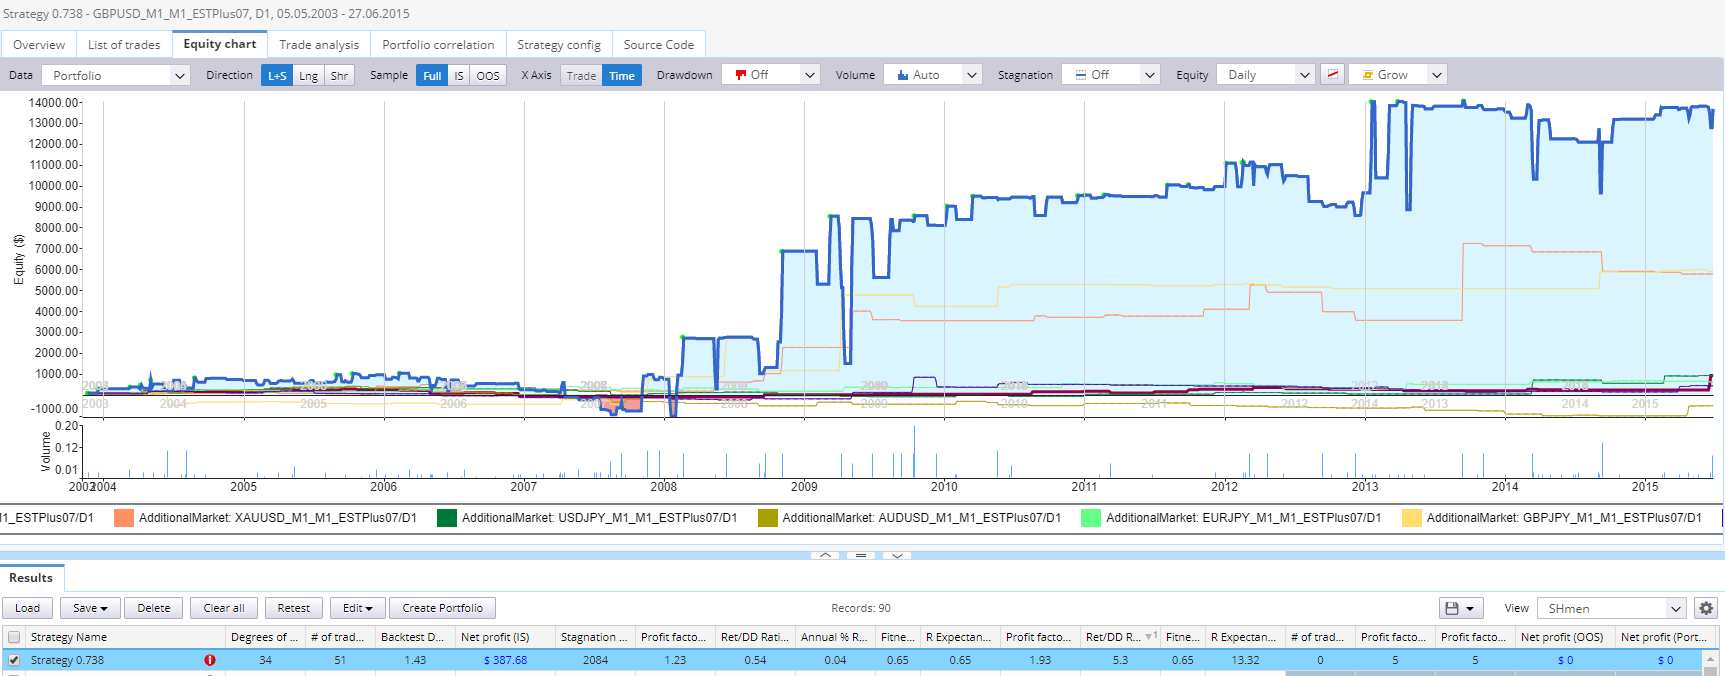
In fact, the portfolio curve doesn't match the portfolio parts very well at all, drawdowns by the portfolio line where no drawdowns are shown for the portfolio parts lines.
MF
#12

Mark Fric

23.07.2019 11:34

Priority changed from Normal to High

there is somehting strange, we will look at it.
TT
#13

Tamas

23.07.2019 16:37

Status changed from Confirmed to Fixed


Votes: 0

Drop files to upload

or

choose files

Max size: 5MB

Not allowed: exe, msi, application, reg, php, js, htaccess, htpasswd, gitignore

...
Wait please