All Drawdown Reporting
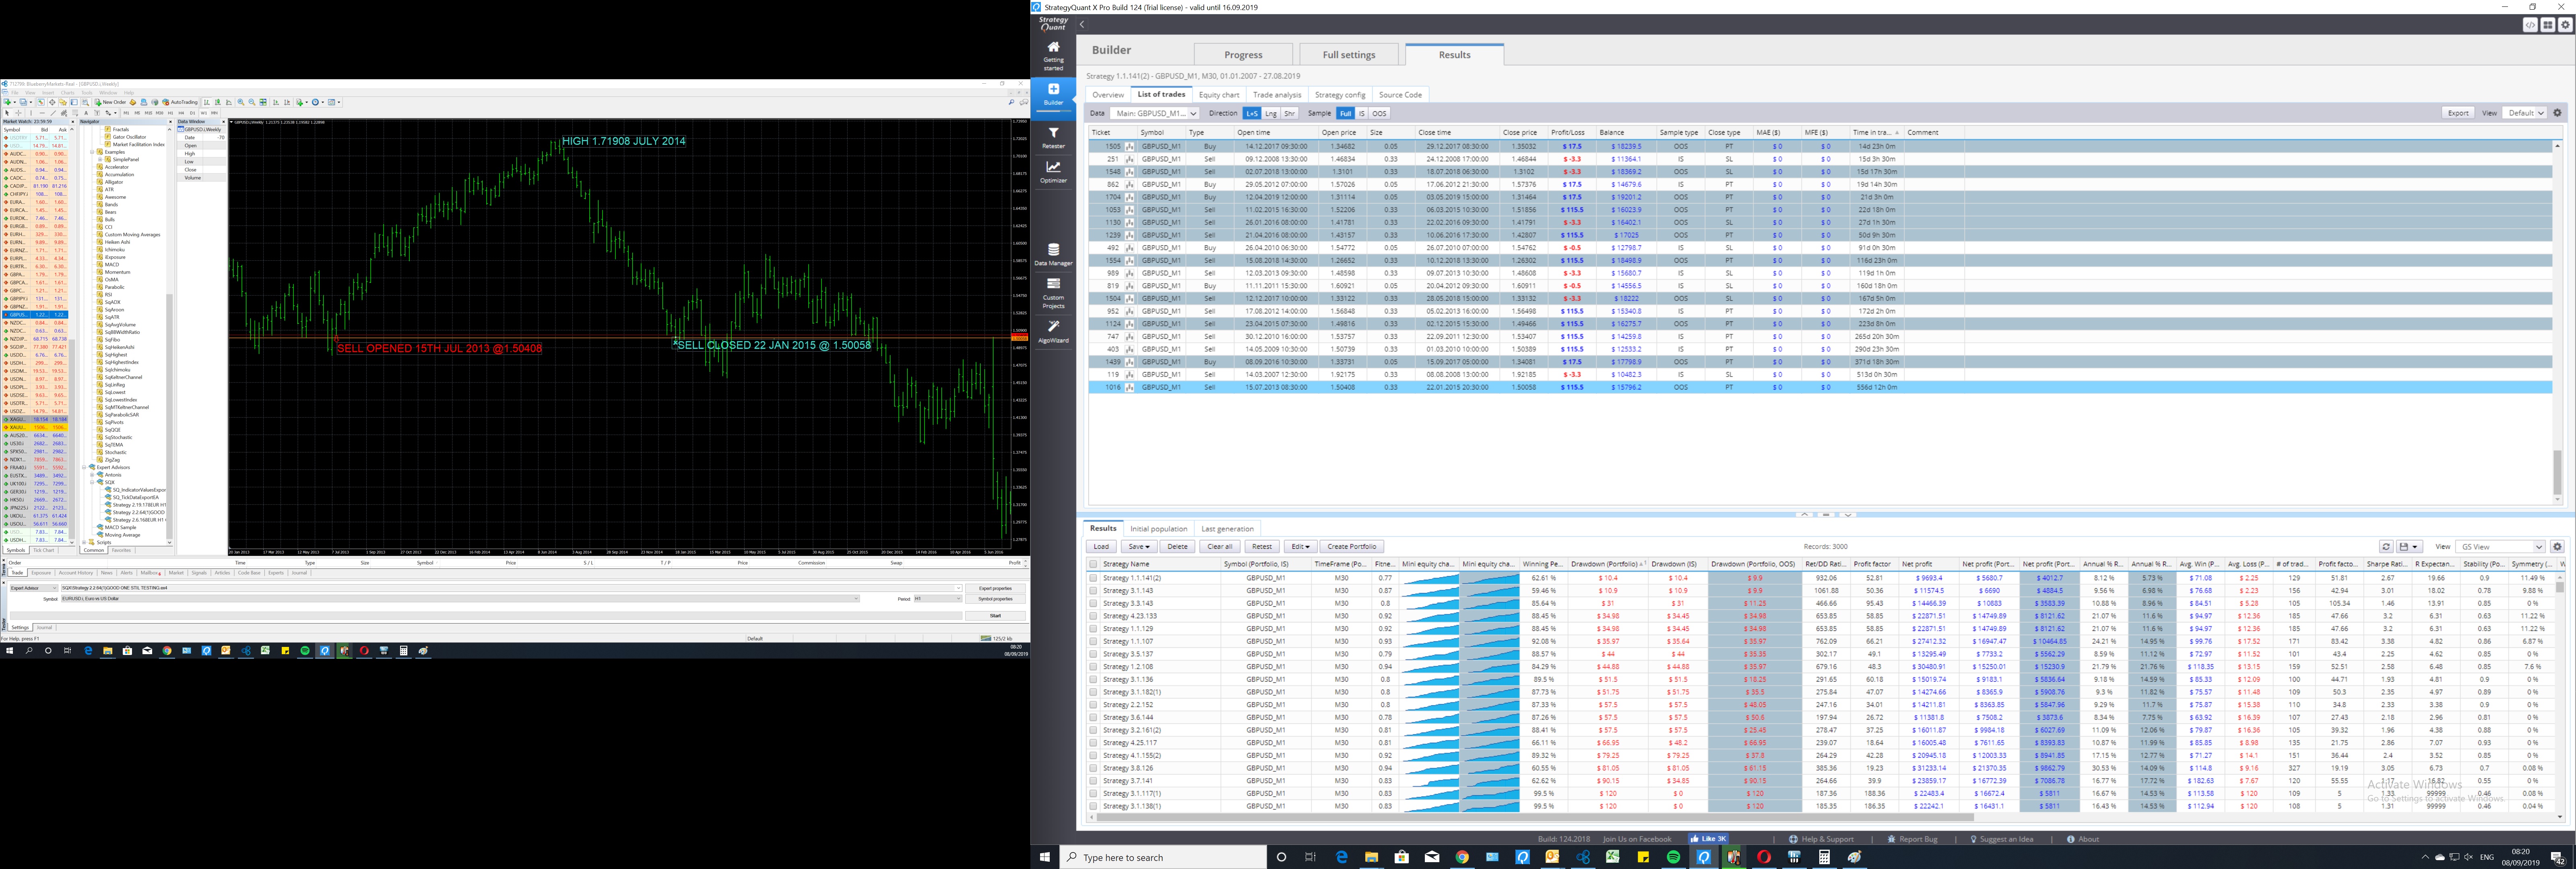
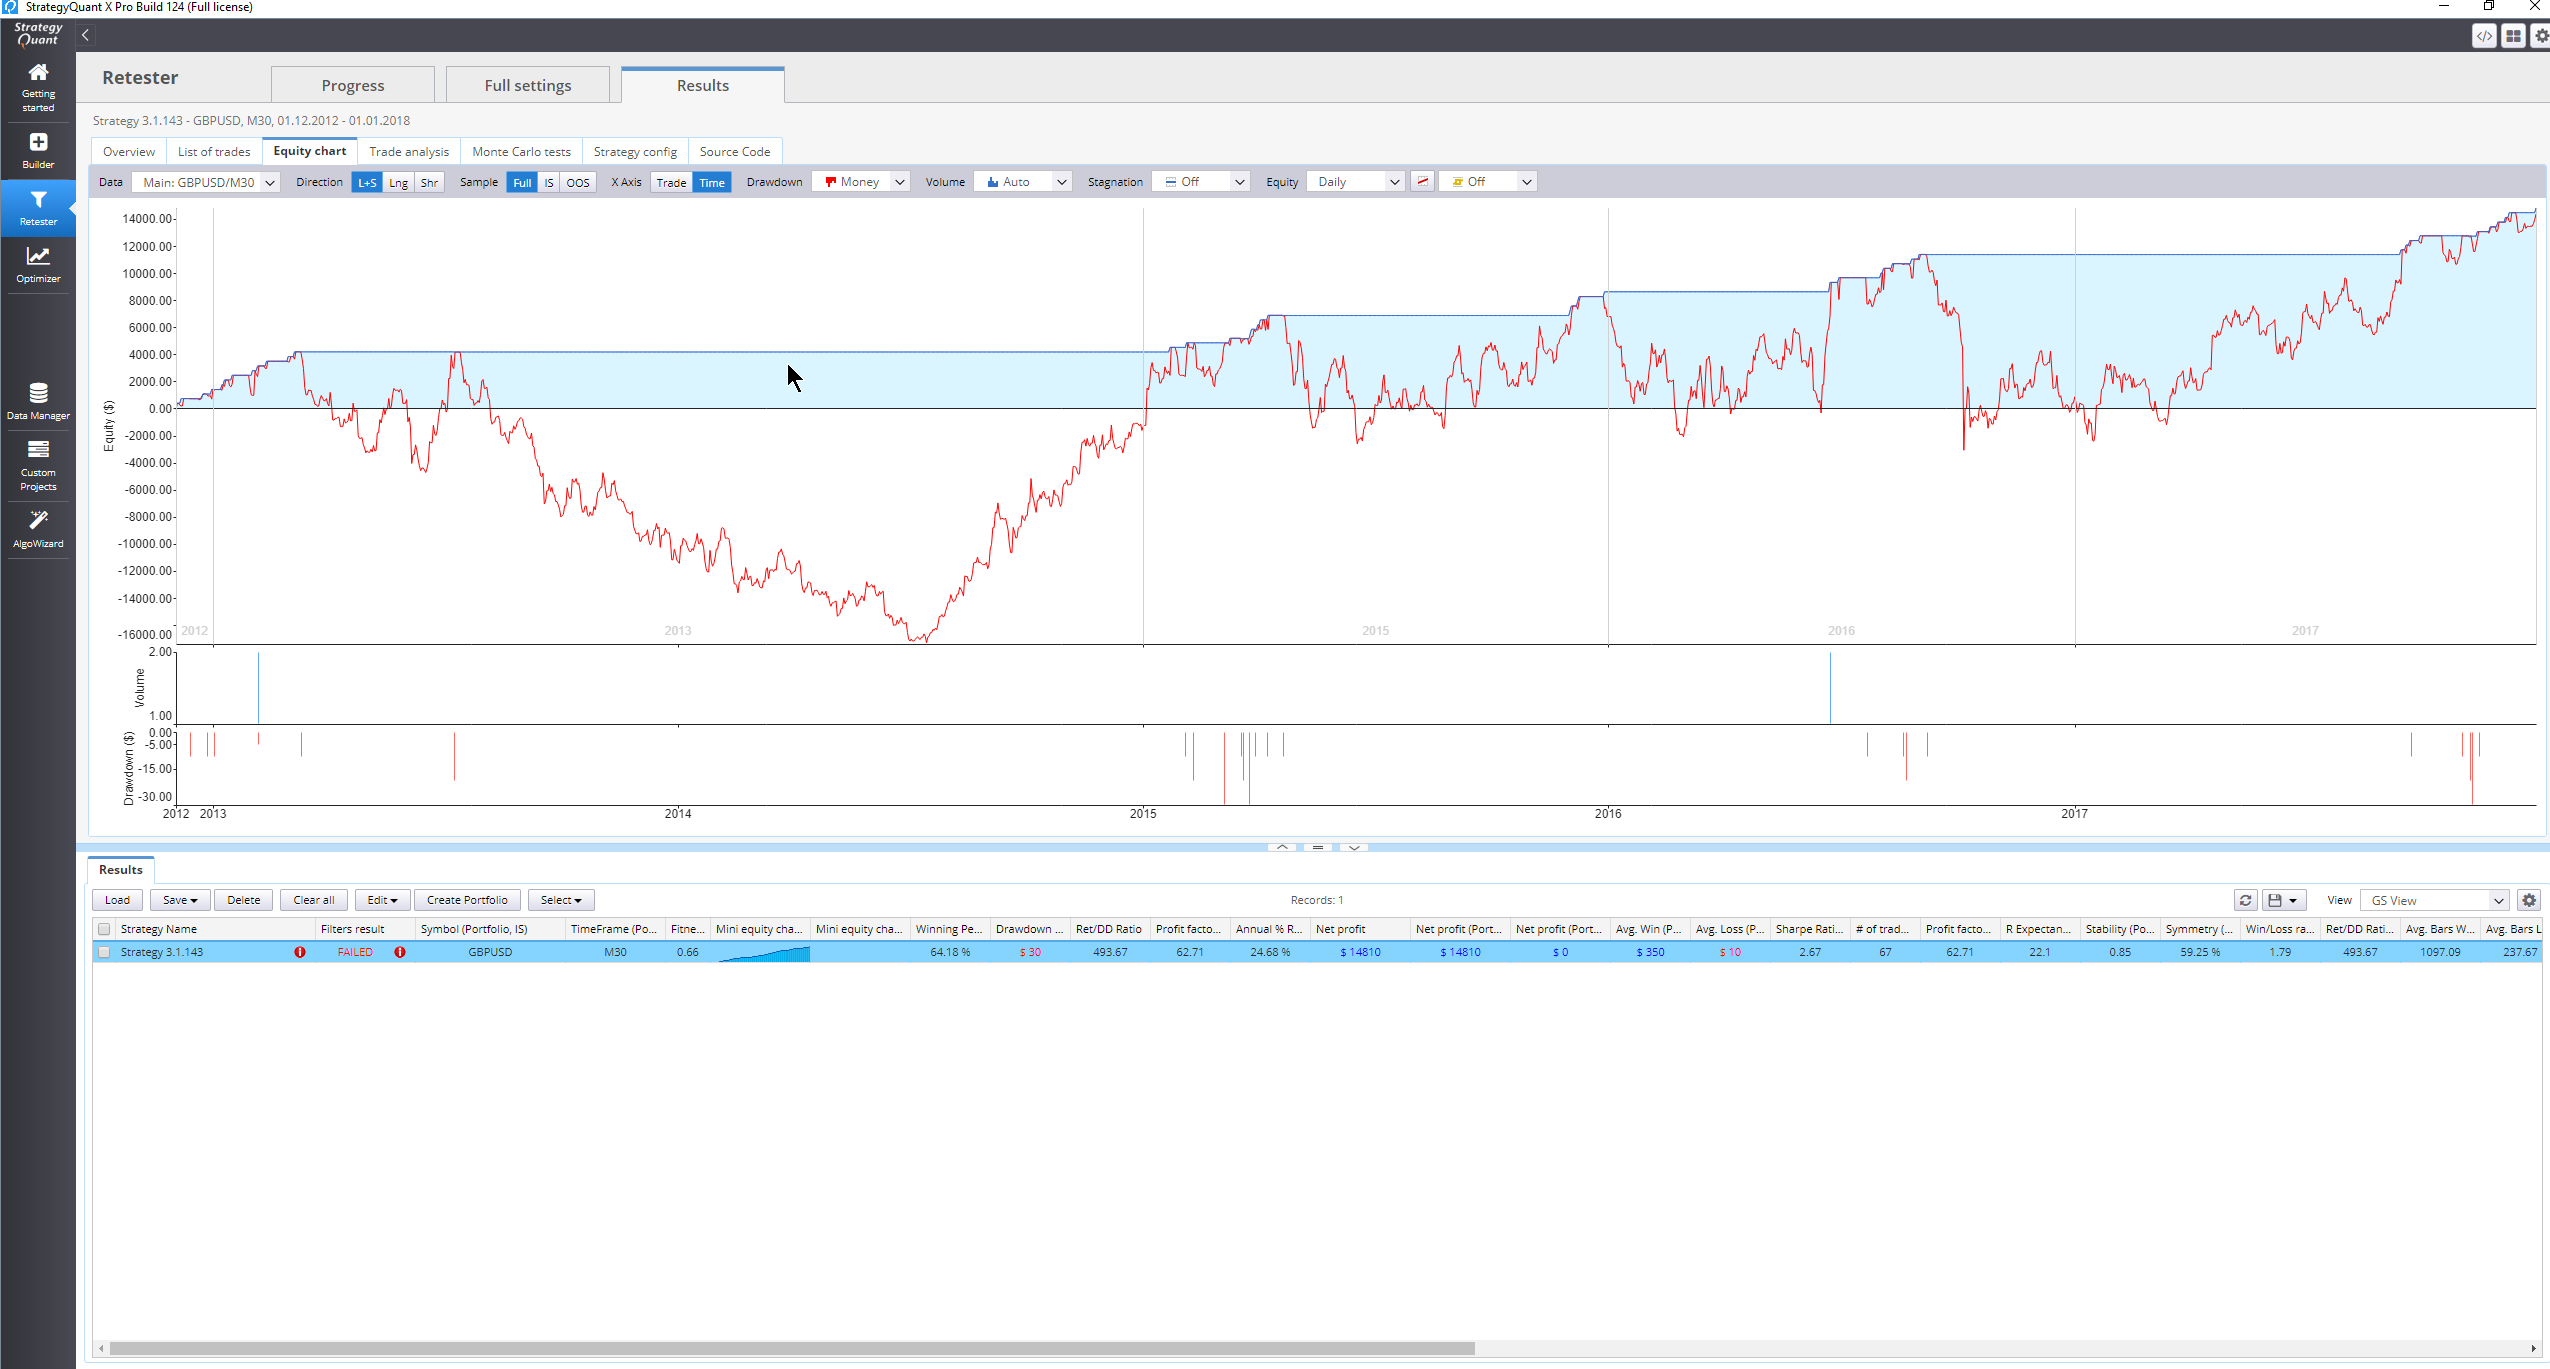
I have seen in many forums that this is a problem because your backtests show very good smooth rise with small dips whereas the true equity chart is far from that as can be seen with the attached which has MAE and MFE data. Why is there no way of using the MAE/MFE to filter as this would knock the PASSED strategies down to a third or more of what they are incorrectly passing..
I hope I am incorrect because I bought this program in good faith of the backtests being completely true and honest in their reporting.
Please let me know asap as I did want to use a few of the generated strategies but my confidence has been eroded by what I've seen.

-
Votes +2
-
Project StrategyQuant X
-
Type Bug
-
Status Refused
-
Priority Normal
History
hankeys
23.09.2019 16:22Attachment DD.jpg added
GRoundofInferno
23.09.2019 16:31gsethi
23.09.2019 16:43hankeys
23.09.2019 19:00GRoundofInferno
23.09.2019 22:12Mark Fric
24.09.2019 08:46And they are displayed on equity chart as MAE/MFE or daily equity lines. There's no need to display separate open drawdown subchart.
We cannot compute open loss in portfolios, because SQ doesn't retest the portfolios - it only combines the results of individual strategies. So we don't know what would the real open loss be if portfolio traded all strategies simultaneously.
QA tries to simulate open balances usign historical prices, it is little bit less exact than SQ, because it doesn't really "trades" the startegy.
You are right that naming could be unified, we'll rename it to Max Open Drawdown in the next version
mikeyc
28.09.2019 13:01https://strategyquant.com/forum/topic/4416-sq4-early-preview/page/52/#post-248344
Each individual strategy in a portfolio has a daily equity chart. I cannot see any reason why they cannot be combined to produce a daily equity chart for a portfolio. The portfolio daily open equity is simply the sum of these charts.
Without knowing this the program is useless.
© Copyright. All rights reserved. ProjectPanel.com

But you can use MAE/MFE or daily equity for this.
We also added new databank column "BiggestOpenLoss" in version 123 that you can use in both databank and in your filtering conditions.
Alsom, your strategy doesn't use StopLoss at all. I recommend you to make SL required in building blocks, otherwise you'll be getting this kind of strategies.