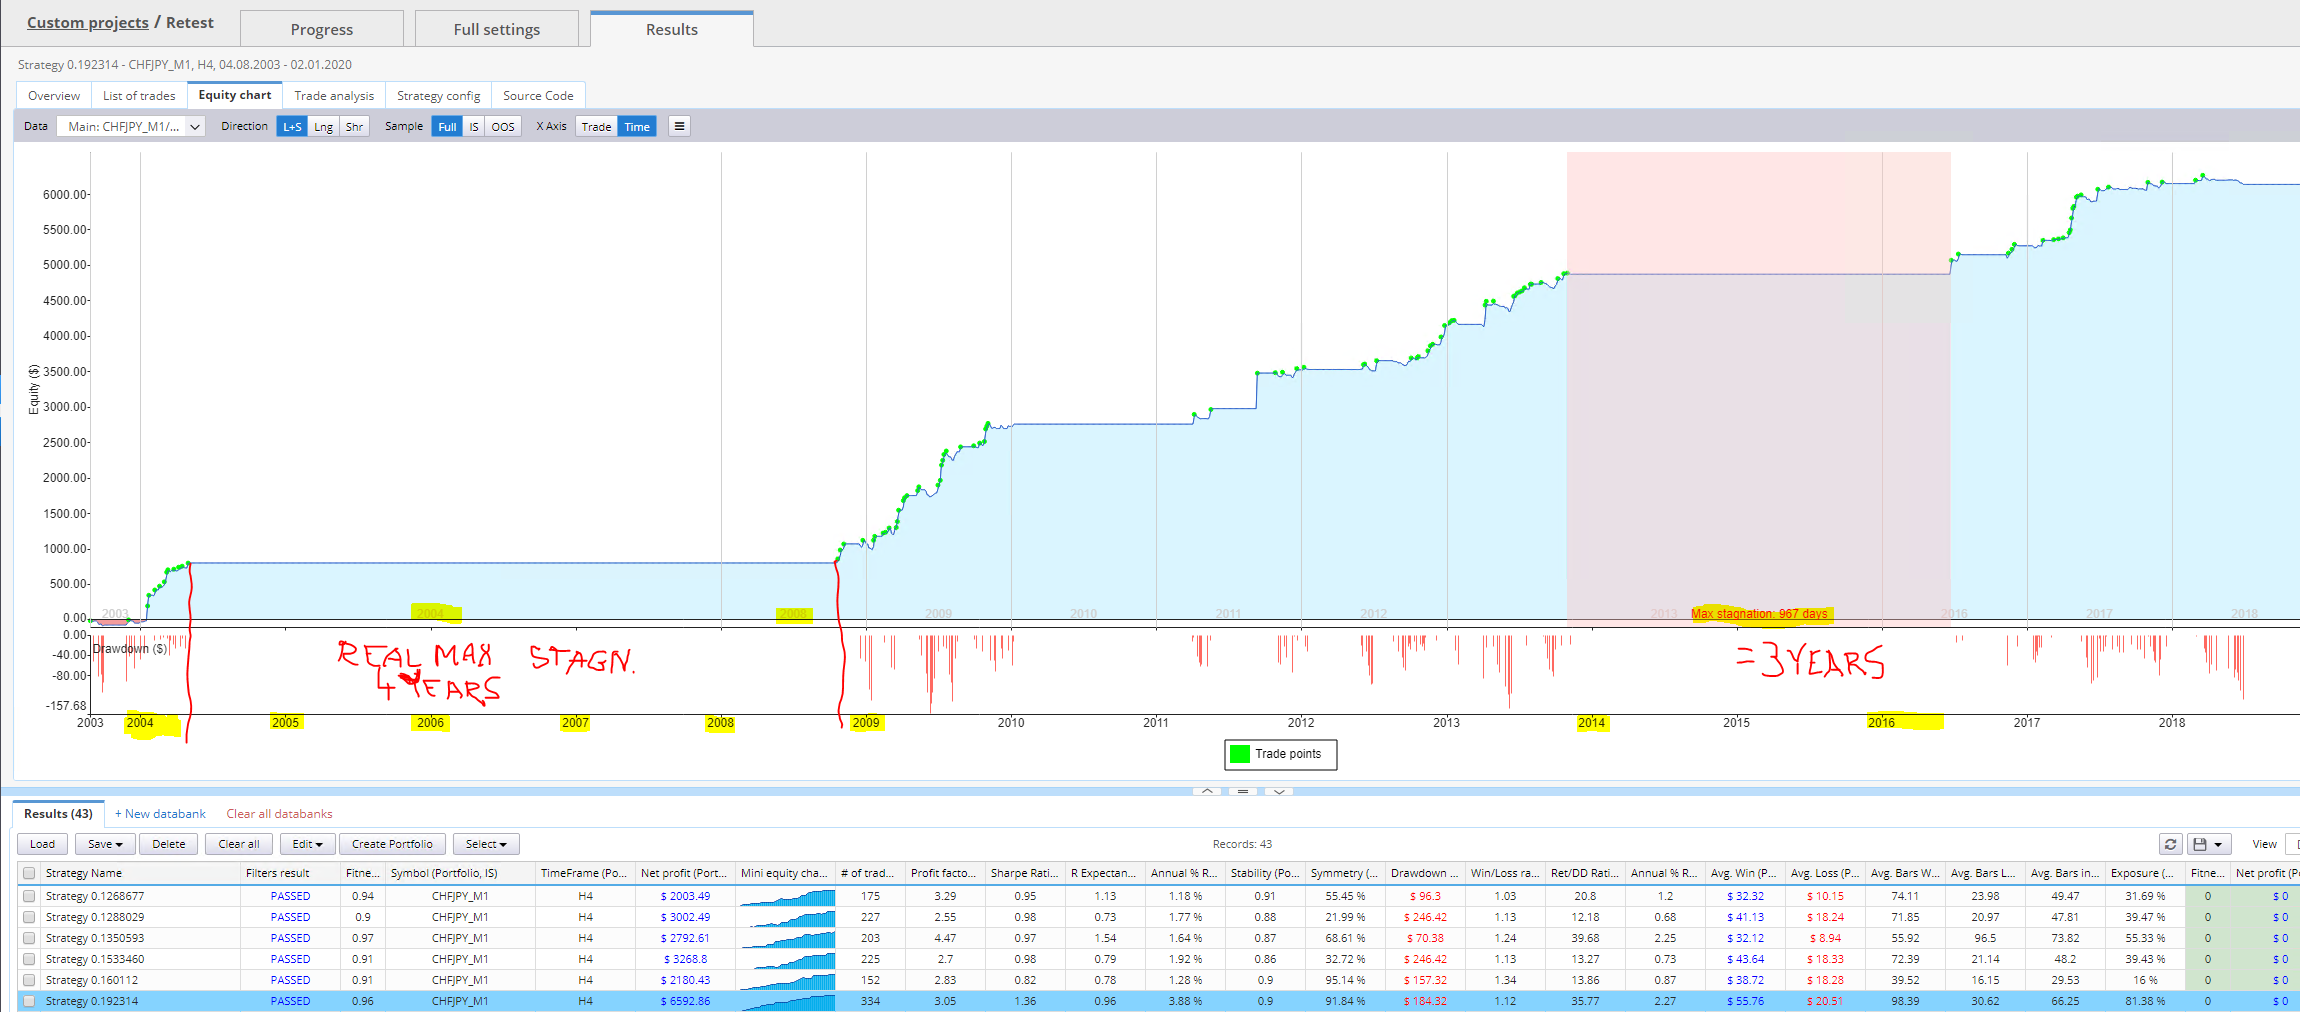
Max stagnation is displayed incorrectly on equity chart + time scale issue
SQ-X Build 126
- Displayed max stagnation: 967 days
- Real max stagnation: ca. 1400 days
- The year 2004 on the upper scale equals years 2005-2008 on the bottom scale
I have attached a screenshot and strategy file for reference.
Kind regards,
Marcin
-
Votes +1
-
Project StrategyQuant X
-
Type Bug
-
Status Fixed
-
Priority Normal
History
Votes: +1
© Copyright. All rights reserved. ProjectPanel.com
