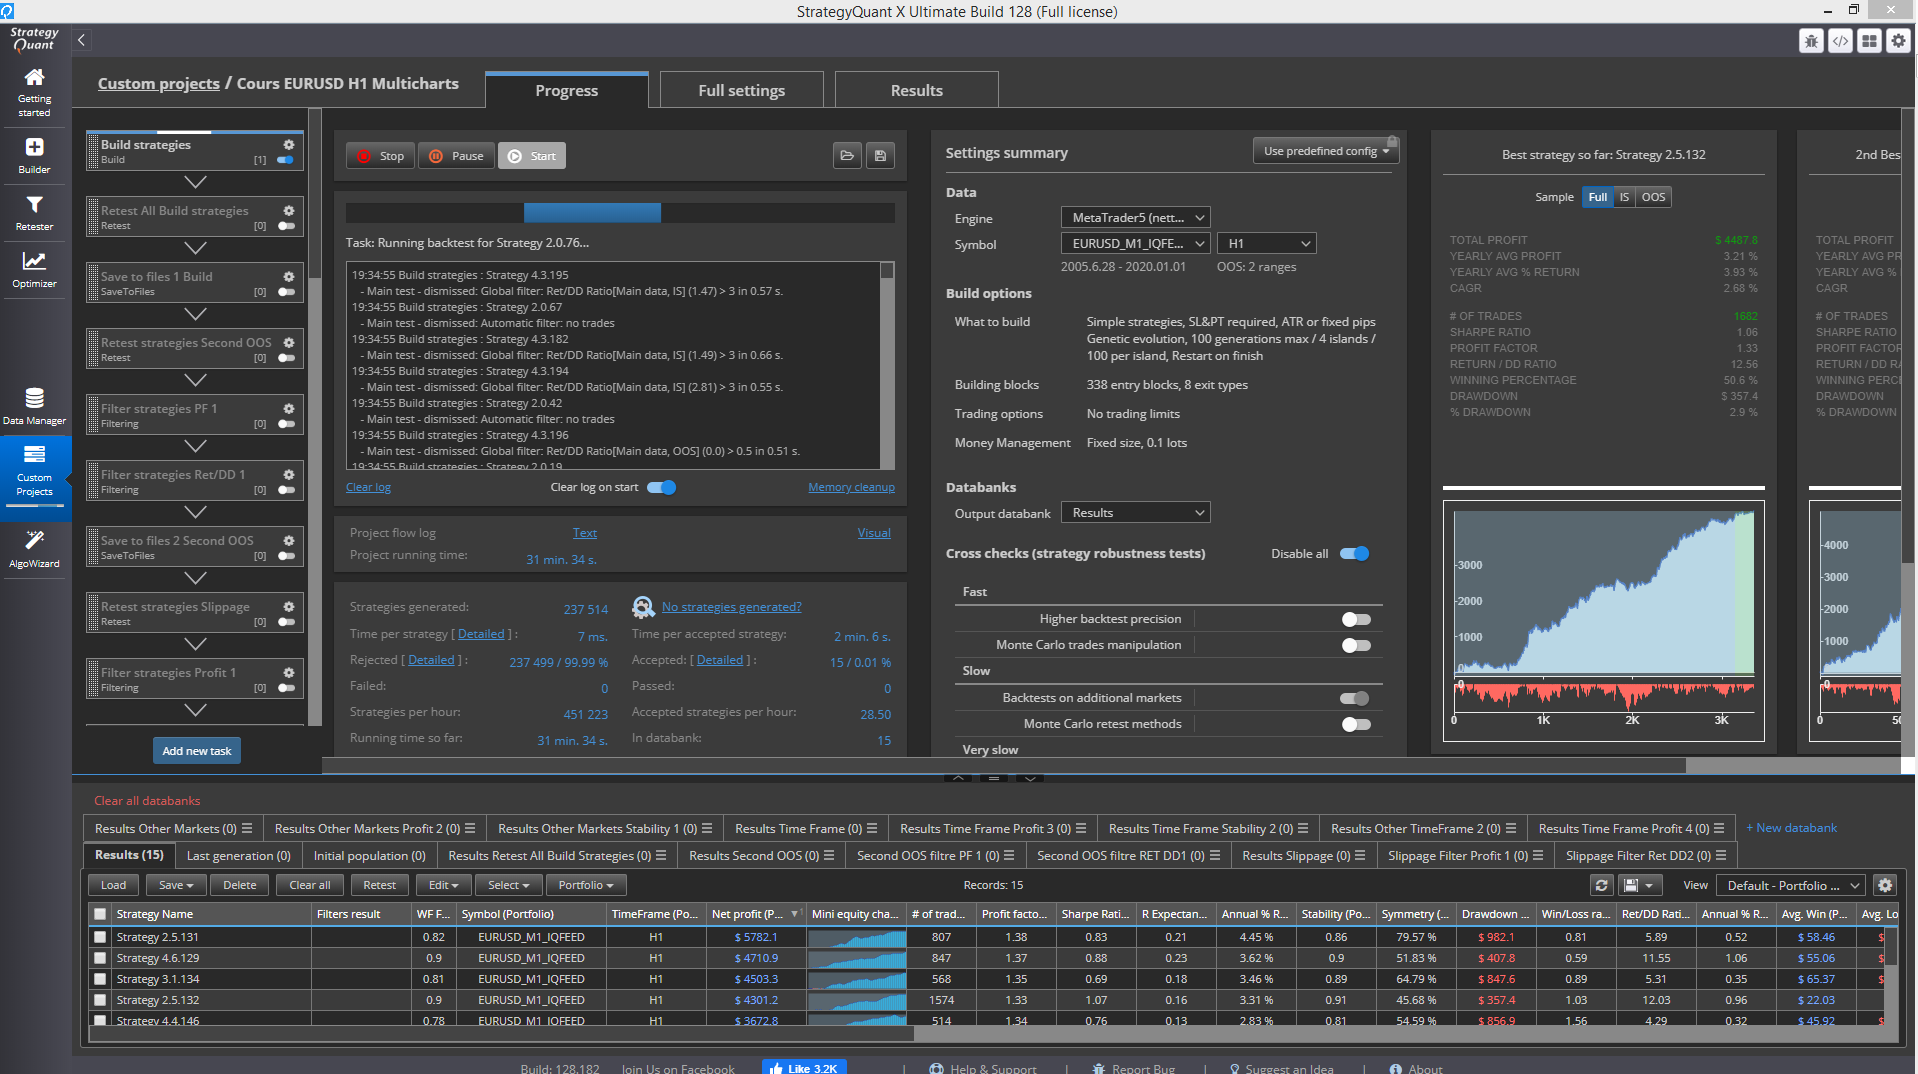
when I am building strategies with Multicharts engine, I have much less accepted strategies per hour
Video at :
https://drive.google.com/file/d/1awwtjCEkdLBdstZGG-7FIplOIS9Cs9W5/view?usp=sharing
-
Votes +2
-
Project StrategyQuant X
-
Type Bug
-
Status Refused
-
Priority Normal
History
Emmanuel
16.06.2020 14:44Description changed:
Video at :
https://drive.google.com/file/d/1awwtjCEkdLBdstZGG-7FIplOIS9Cs9W5/view?usp=sharing
Emmanuel
16.06.2020 21:04Attachment Strategy 41134.sqx added
Attachment Test Strategy 41134 on Metatrader 5 d.png added
Attachment Test Strategy 41134 on StrategyQuantX.png added


I tested one strategy (41134) on Metatrader 5 to compare the Metatrader 5 results and StrategyQuantX results .(with MT5 Netted engine)
As Metatrader 5 and StrategyQuantX don't have the same data and engine, I don't expect to have the exact same trade.
But I would expect to have about the same shape.
Here, we can really see the the MT5 engine give a different results than StrategyQuantX.
Metatrader engine of StrategyQuantX seem to give too much positive results when we compare with Metatrader 5.
Is it possible ? Is it because the way the Metatrader engine buy or sell ? on the lowest / highest of the candle ?
hankeys
17.06.2020 07:01
if i tested it in my dukascopy data cloned to UTC2 timezone (which you need to do - because most probably you will not be trading with UTC0 broker), i am getting these results
Mark Fric
18.06.2020 09:32
Anyway, I tries your project with both engines, and I'm getting a similar number of accepted strategies, even more for MultiCharts than for MT5.
Do you have both MT5 and MultiCharts? You should create strategies specifically for your trading platform, trading engines of MT and MC are so different that strategies might not work the saem in both engines.
Emmanuel
18.06.2020 10:40Yes I have MT5 and Multicharts for many years. I am as well engineer and professional developer in this industry and I am here to help if you allow me.
If we try the same project, why do we have differents results ?
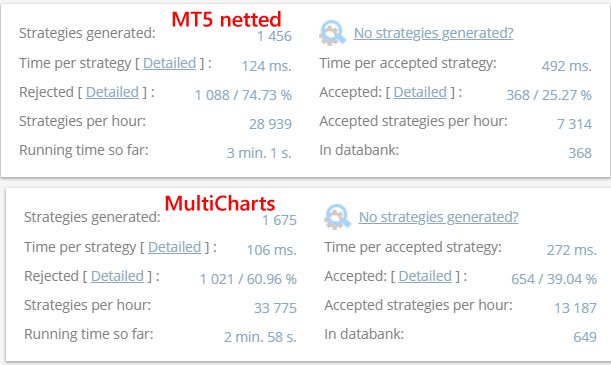
You have 25.27 % of accepted stratégies for MT5 Netted and 39.04 % of accepted stratégies for Multicharts. This is really high.
On my side I have 0.19 % of accepted stratégies for MT5 and 0.01 of accepted stratégies for Multicharts. The test was made with the parameters of the courses of Mr Zanka.
We clearly don't have the same parameters.
Following your recommendation I will focus on Multicharts and create strategies with Multicharts engine. I know well Multicharts.
Mark Fric
18.06.2020 10:47Status changed from Refused to In progress
Can you please attach your projecs for MT5 and MultiCharts that cause this? I'll look again.
Emmanuel
18.06.2020 11:18Attachment Cours EURUSD H1 V2 Custom Project Config4.cfx added
Thank you very much Mr Fric for considering it.
Here is the project I am building with the parameters of the second courses of Mr Zanka.
I hope this will help. I am willing to help as much as I can (computer power, development, etc.)
One way I could help would be to focus on the Multicharts part.
Please let me know.
Mark Fric
19.06.2020 13:36How did you get EURUSD data you are using?
When I try your custom project it doesn't produce any accepted strategies.
Even when I retest the strategy you attached with the same settings I get a totally different equity curve.
I'm using standard Dukascopy data downloaded to SQ.
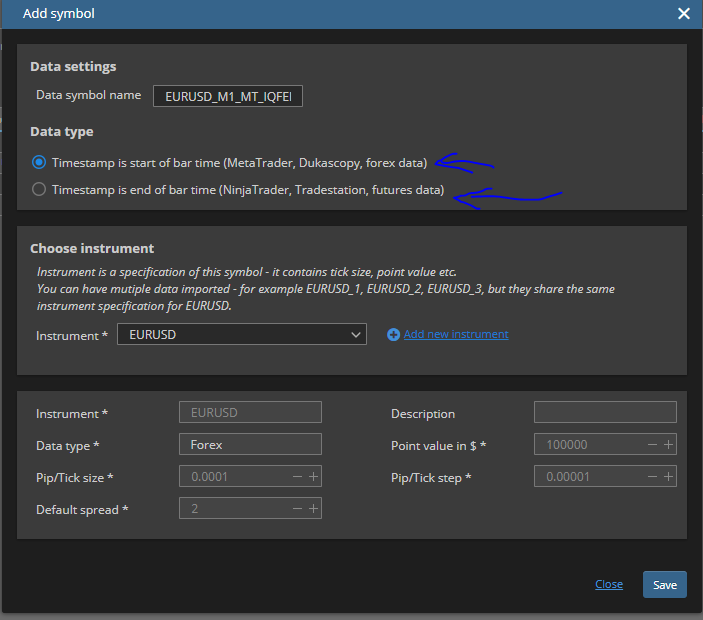
There's one more issues when switching between MetaTrader and MultiCharts. Each uses different bar settings.
For MultiCharts it is "Bar time is end of bar", for MT s is "Bar time is start of bar"
This affects how higher timeframes are computed and it could have big impact. YOu should use the same data you'll be using in each of your platform.
To make sure you have correct setup and reproducible results generate just one random strategy in SQ for yout trading platform, and then retest in on that platform. If the results are too different there s some problem in your SQ configuration or data.
Emmanuel
19.06.2020 13:45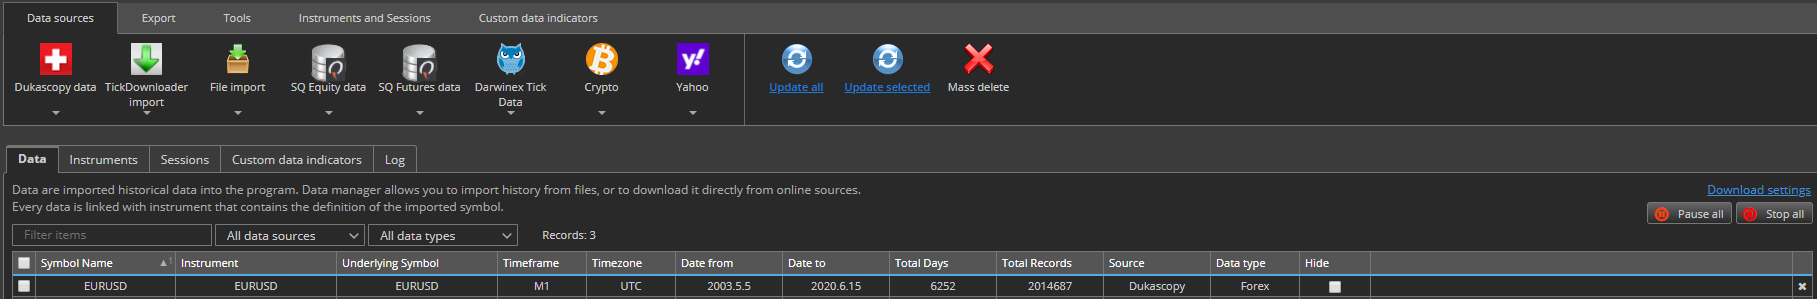
I am using EURUSD from Dukascopy
(I attache a copy of my screen)
I downloaded the data from SQ.
I did the same test with the imported data from Multicharts as well. (with the option "Timestamp is end of bar time")
And I am getting the same number of accepted stratégies in Multicharts
I use this data Inside Multicharts : (IQfeed) https://drive.google.com/file/d/11Jt_ZILfjsgh0TLWjxxgp4x8ls5EL8ck/view?usp=sharing
Emmanuel
20.06.2020 21:58Attachment Capture MC close to close.png added
Attachment Capture SQ Equity chart.png added
Attachment Capture MC trade 972.png added
Attachment Capture SQ trade 972.png added
Attachment Capture MC 36 minutes.png added
Attachment Capture MT 31 minutes.png added
Attachment Capture.png added


After doing a retest I found :
1/ First, I did not install the SQ _ MC indicators properly : I installed SQ.ELD instead of SQ_MC in my Multicharts.
Multicharts imported it without any problem, and gave buy and sell signal in the backtest with SQ stratégies.
even if Multicharts was not able to compile the SQ functions and indicators.( The SQ functions, and indicators was not compiled.)
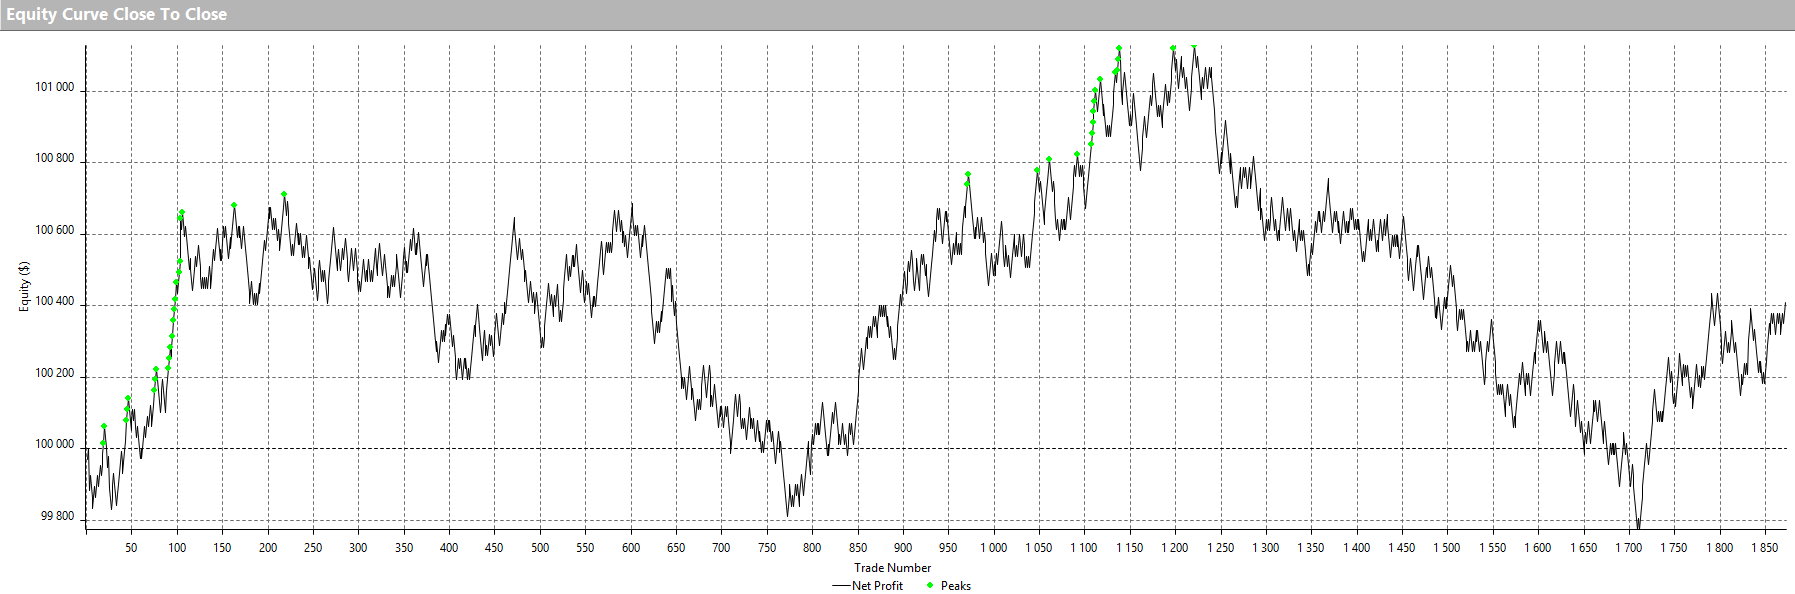
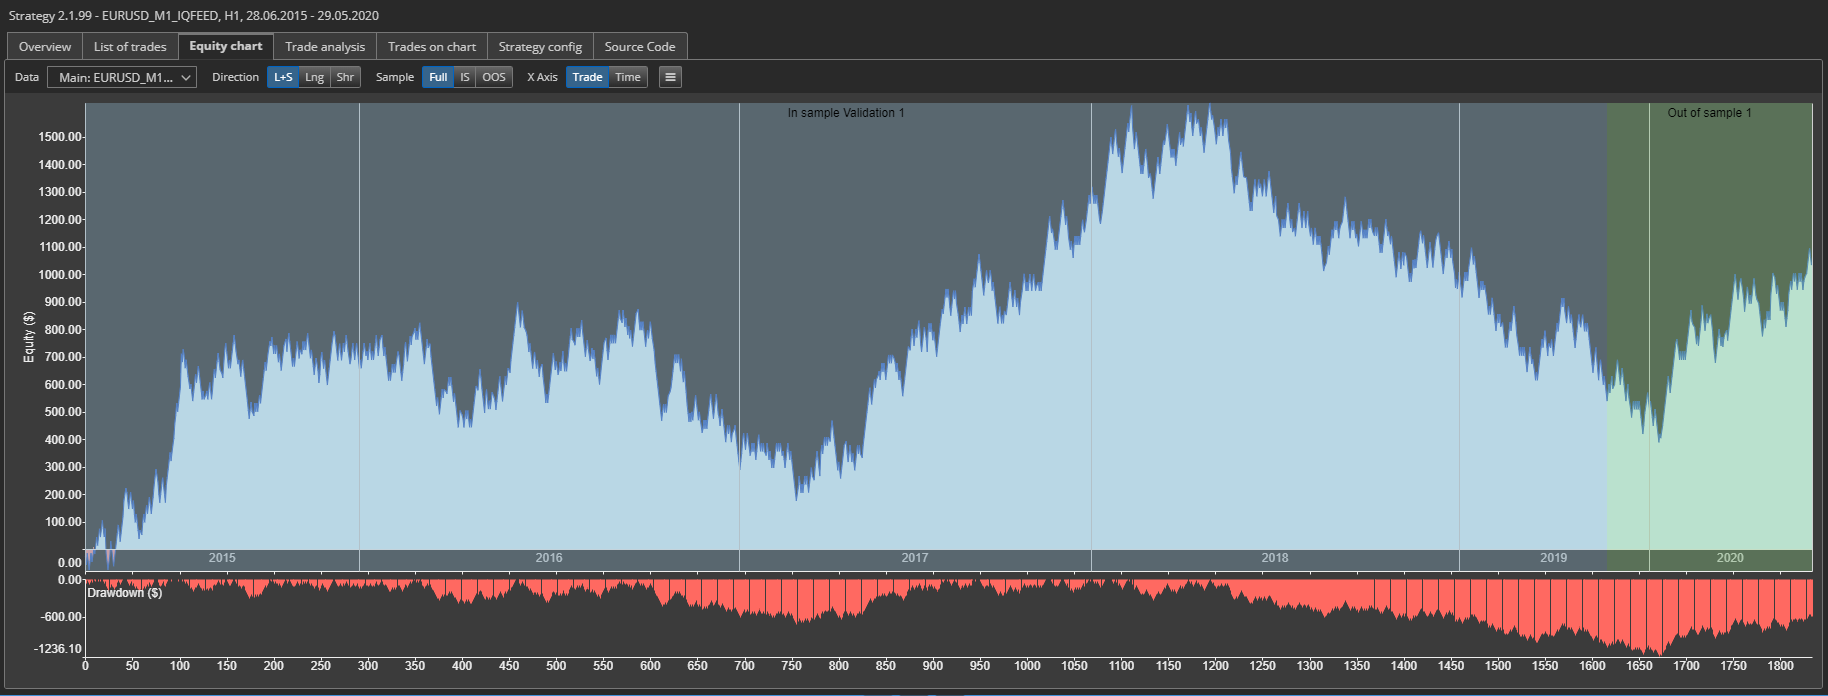
2/Then I was able to get the same results with SQ and MC with a simple SMA strategie (with 30 pips Stop loss and 30 pips Profit Target)
(see Capture MC close to close and Capture SQ Equity chart)
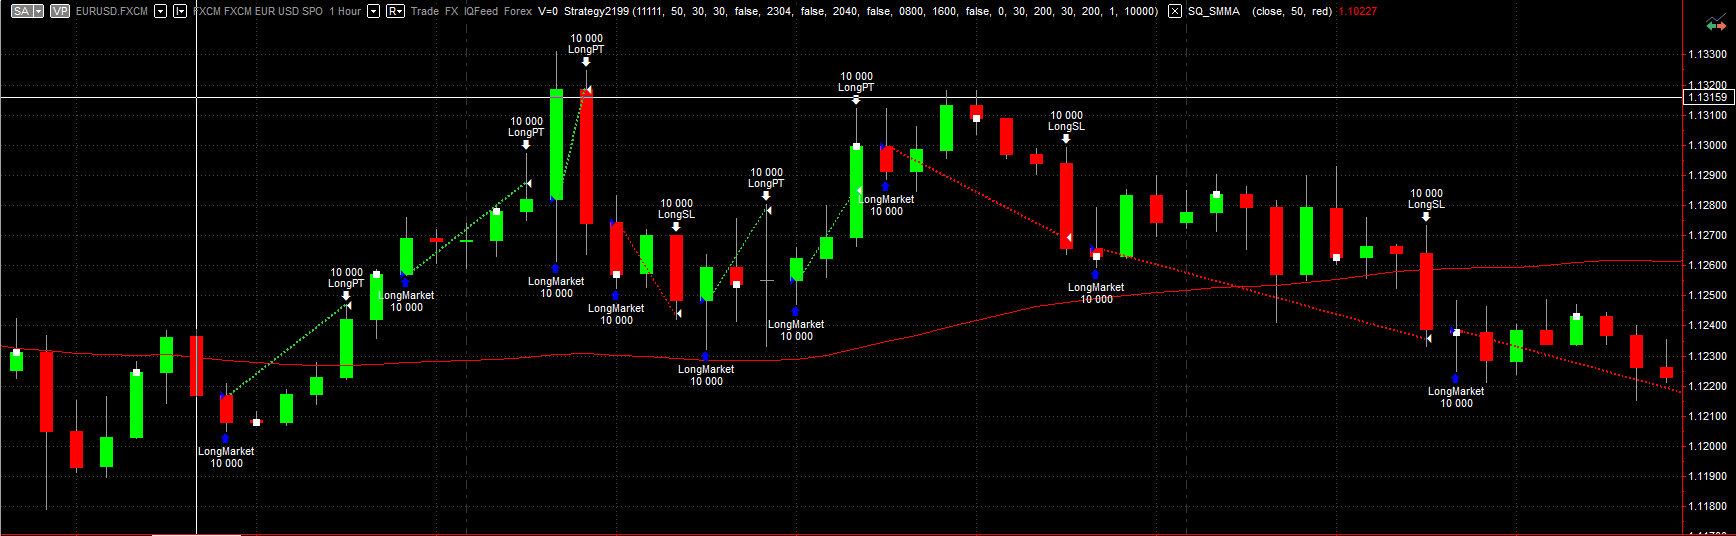
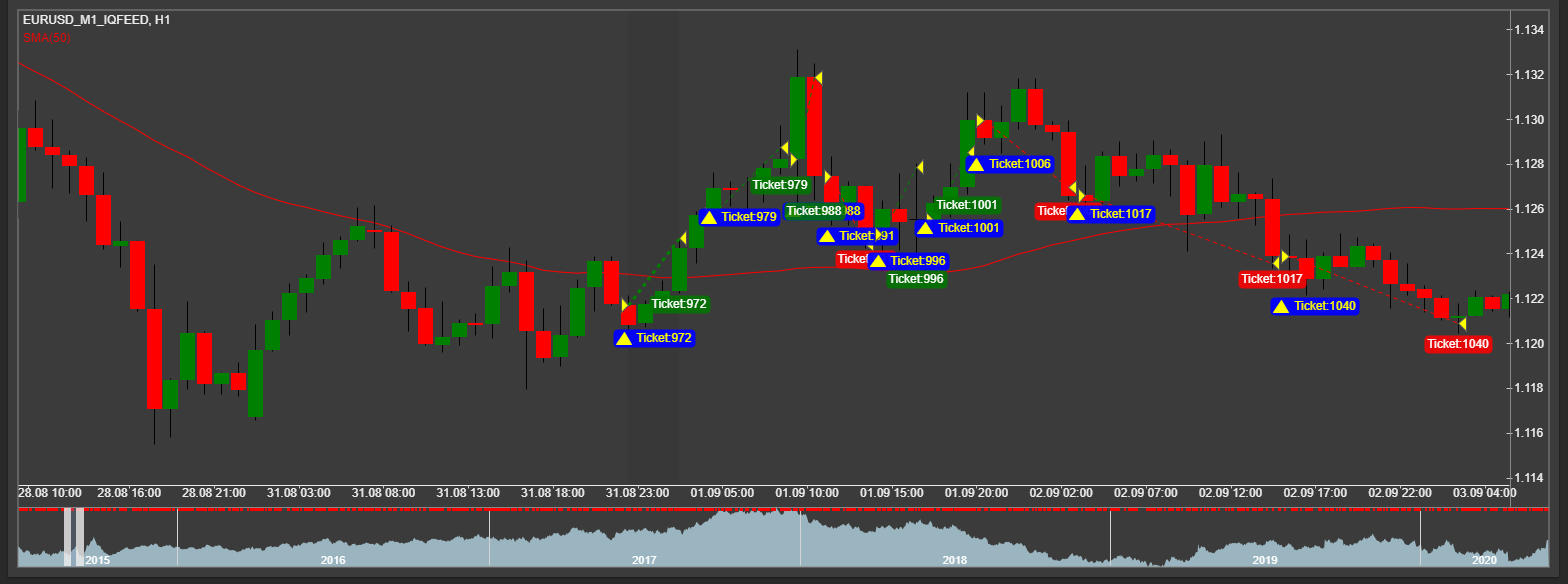
You can see the same trade in Capture SQ trade 972 and capture MC trade 972.
I want to show this for futures Customers , who may need to see this.
To get this results , I focus on a simple strategy with one on indicator SMA
However, I did change : tickSize=0.0001;
I removed the NumberOfShares in the buy order
I removed the SQ_CorrectMinMaxSLPT function
with few minor adjustment in the strategy property box of MC
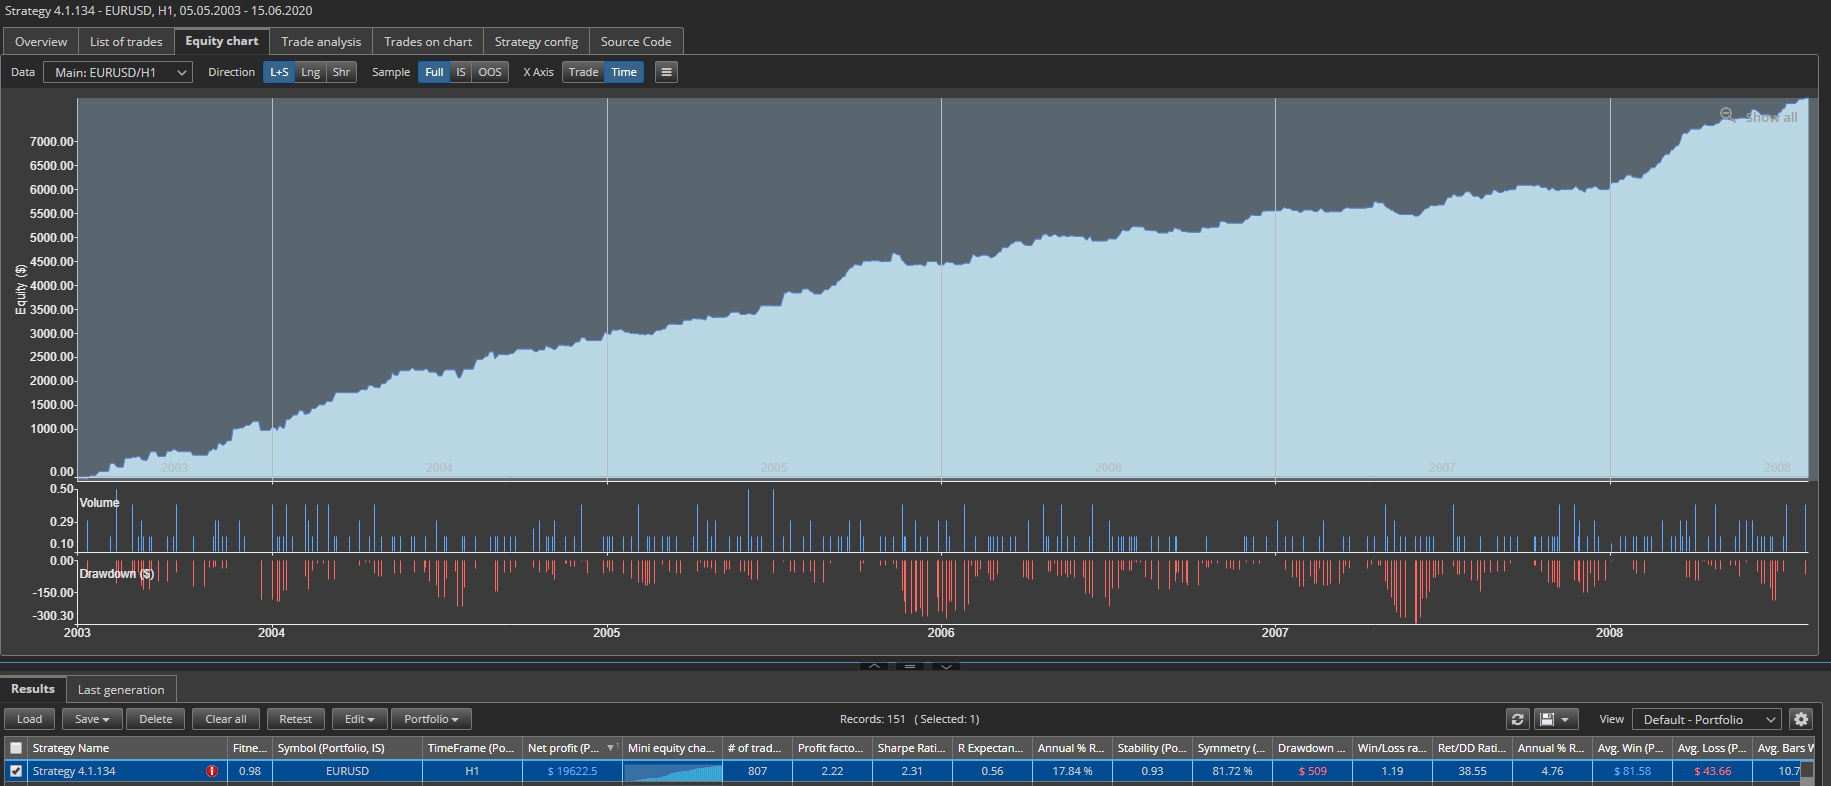
3/ Finally , regarding the question of having more strategies with the Metatrader engine than the Multicharts engine :
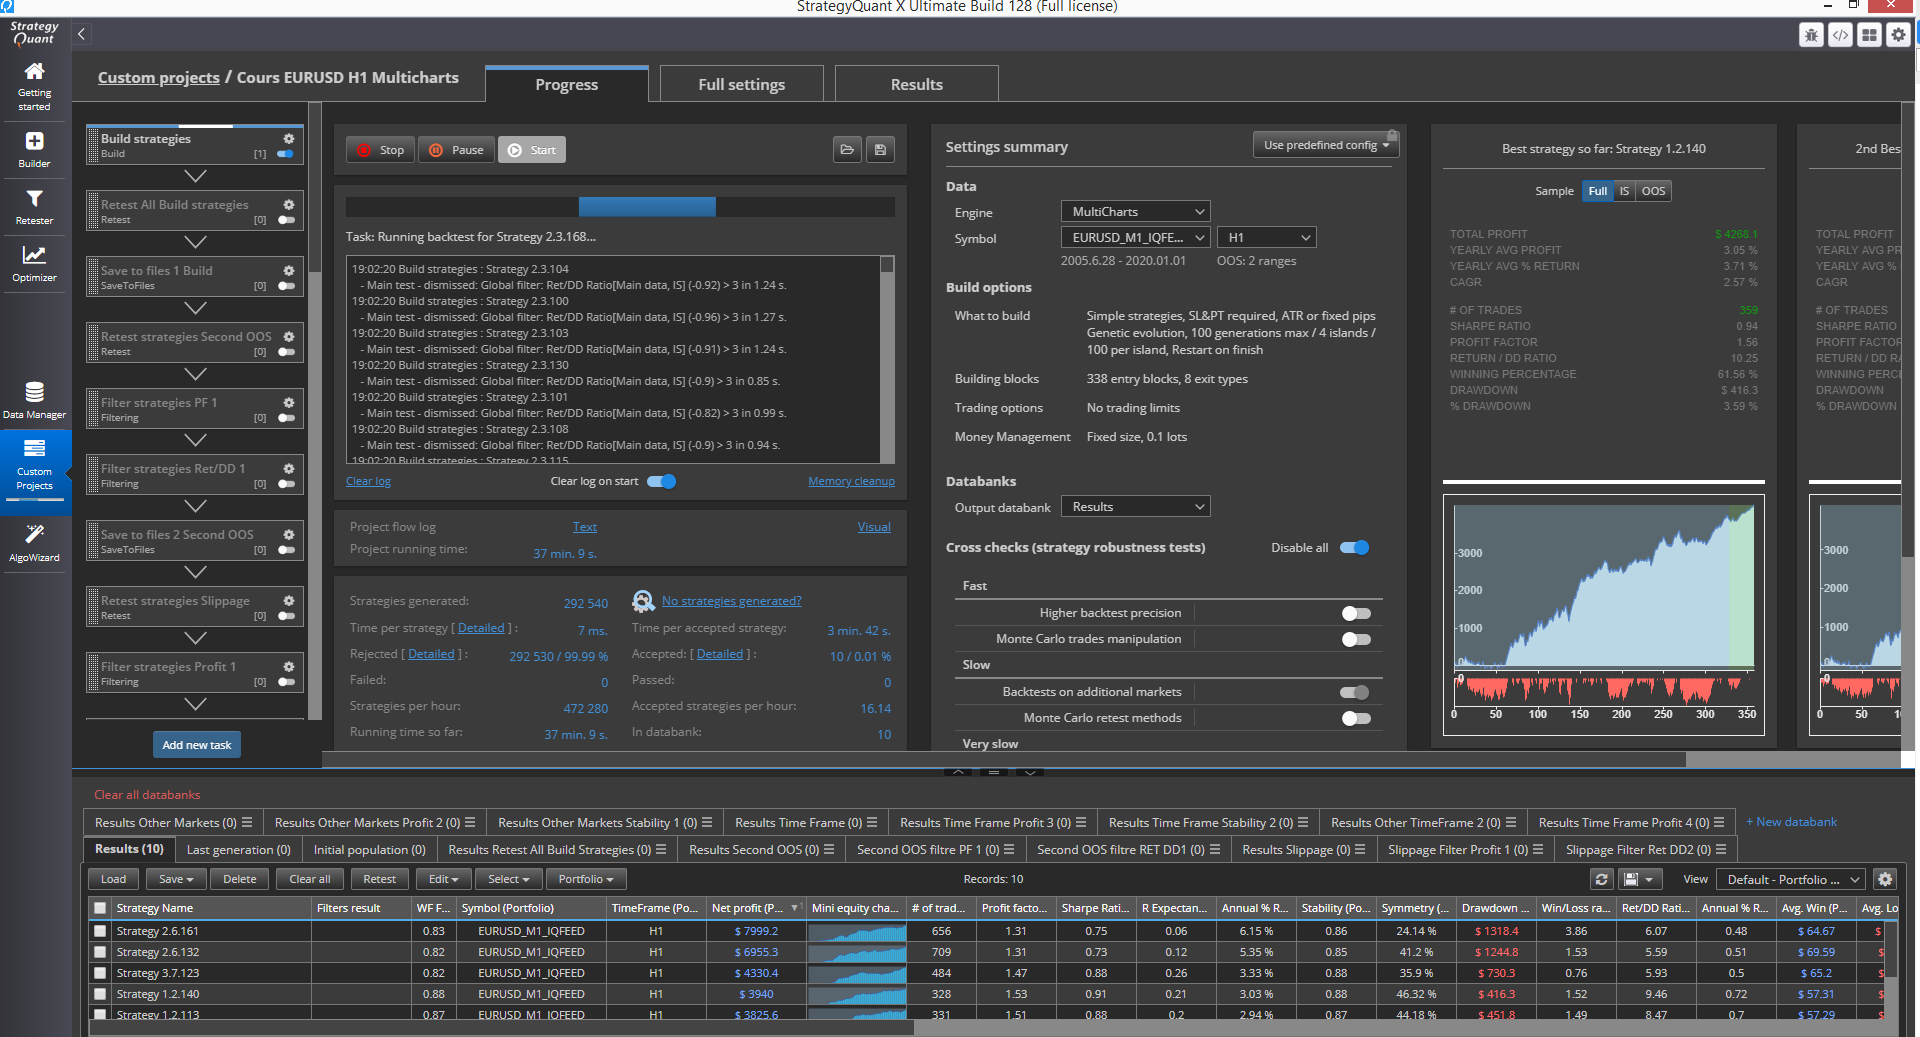
As you can see on the capture MT 31 minutes and the capture MC 36 minutes, both engine MT and MC produce around the same number of stratgies after 30minutes with the same imported data from Multichart. I have around 10 accepted stratégies per 30 minutes. around 3000 $ of profit strategies
However if I use Dukascopy data (downloaded with SQ) with Metatrader engine I have 300 stratégies per minutes.30 000$ of profit stratégies !
Please , look in this new video I made at the minute 4:00 with EURUSD then at 6:22 for GBPUSD, I have the same results. to much unreal stratégies per minute
https://drive.google.com/file/d/1D-wI4-gWd3enOOdqd4Uvc1SrM6CmpEpJ/view?usp=sharing
if I use the multicharts engine with Dukascopy data, it is working fine.
The only unusual behavior is metatrader engine with duskacopy downloaded data.
Mark Fric
29.06.2020 10:41It will allow me to compare the differences.
I see it on the video, but there must be some reason for this behavior.
Emmanuel
29.06.2020 11:40Attachment Strategy 41163 Metatrader 5 Netted.sqx added
Attachment Strategy 43157 Multicharts.sqx added
Please, find attached a strategie with the Multicharts engine : "Strategy 4.3.157 Multicharts.sqx"
and one strategy with Metatrader 5 Netted engine : "Strategy 4.1.163 Metatrader 5 Netted.sqx"
When I select the Metatrader 5 or 4, we have lot more stratégies, much more profitable.
I hope this will help.
Emmanuel
29.06.2020 14:14Attachment MT 5 selected timeframe only Strategy 221891.png added
Attachment Strategy 221891 MT5 selected timeframe only.sqx added
Attachment MT5 Data tick 1 min.png added
Attachment Strategy 21129 MT5 Datatick 1 min.sqx added
I did more test :
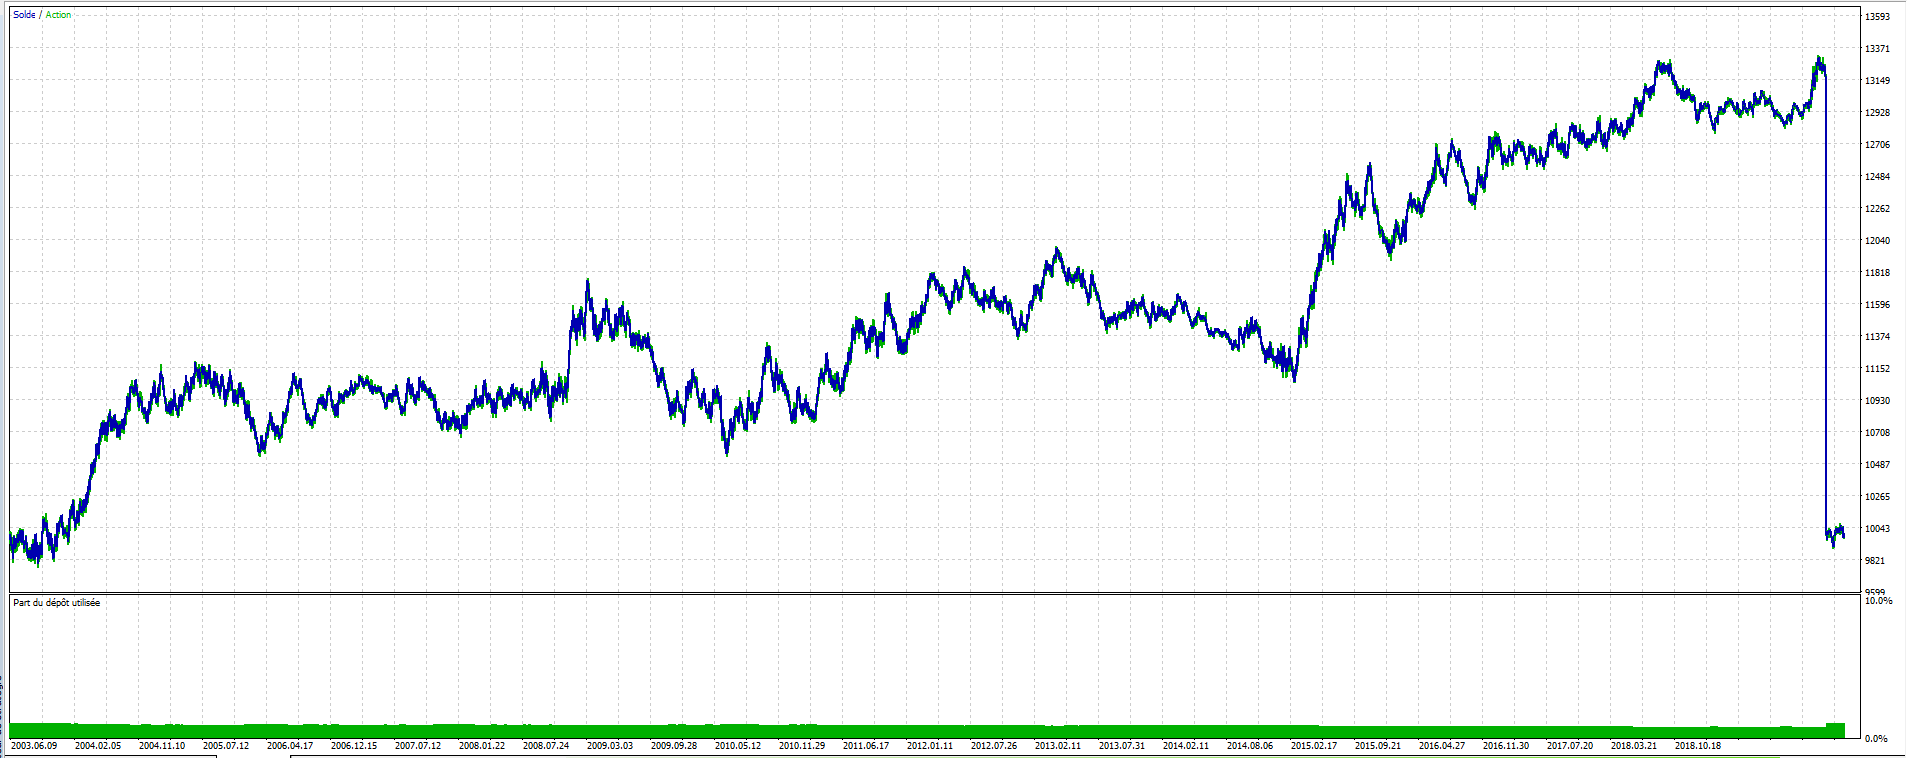
1/ with MT5 engine with "selected timeframe only" (Attached capture : MT 5 selected timeframe only Strategy 2.2.189(1))
2/ with MT5 engine with "1 minute datatick simulation" (Attached Capture : MT5 Data tick 1 min)
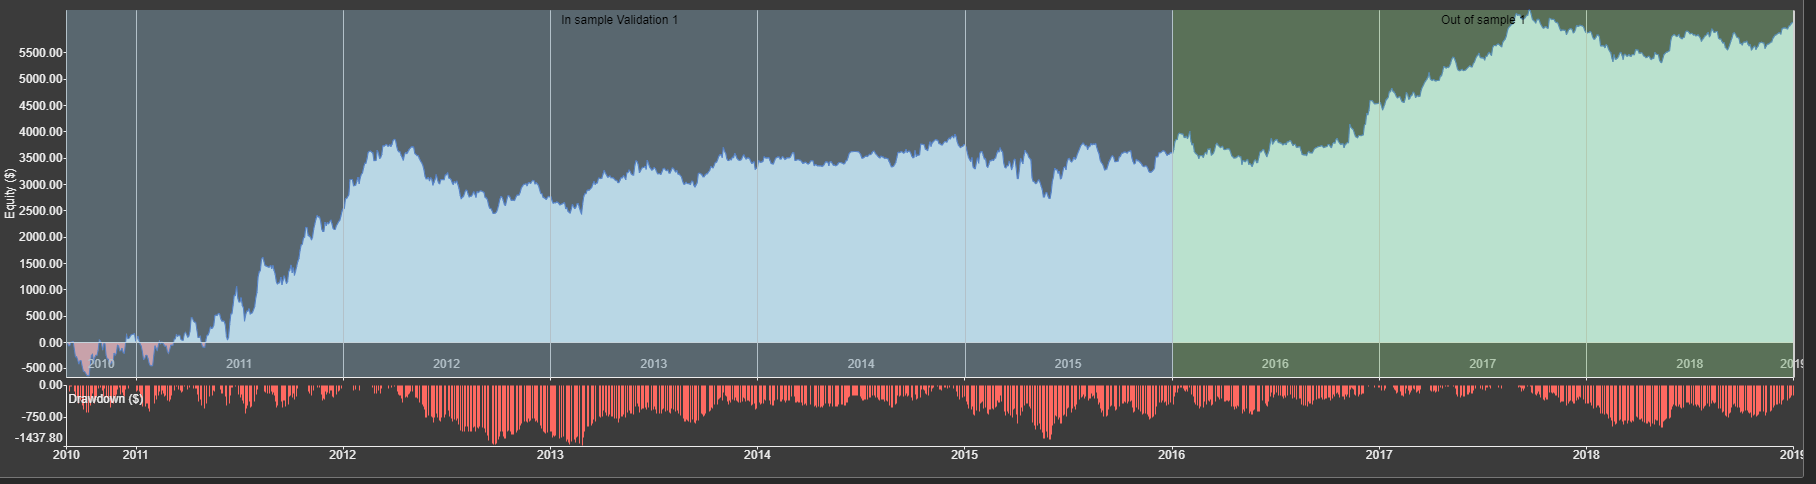
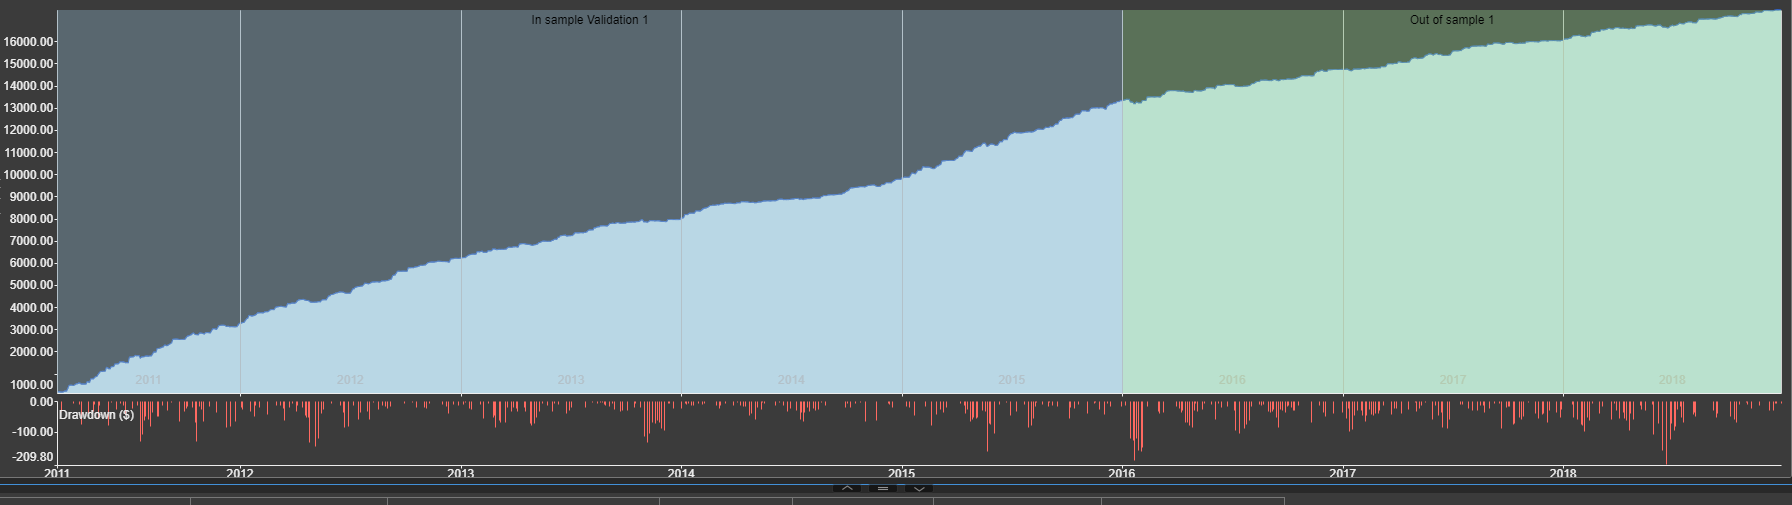
With the selected timeframe only (H1), we can see an equity charts very linear , the profit can go up to 13000 $ IS.
With the "1 minute datatick simulation", we can see an equity chart less linear, the profit is around 3000 $ IS.
There is a large difference between "selected timeframe only" and "1 minute datatick simulation"
The "1 minute datatick simulation" with the Metatrader 5 engine look more realistic. And it looks more like the results I would get with Multicharts engine. I would have the same number of accepted stratégies as well, with similar results .
Finally the real difference would be between "selected timeframe only" and "1 minute datatick simulation" with the Metatrader 5 engine ?
Mark Fric
30.06.2020 12:27Status changed from Waiting for information to Refused
Please try to delete all the files in /internal/testfiles , they are generated datafeed files and they seem to be incorrect. They'll be regenerated again when you'll start builder or retester.
The whole issue seems to be caused by these bad data, I'm closing this task, there doesn't seem to be anything to solve.
Emmanuel
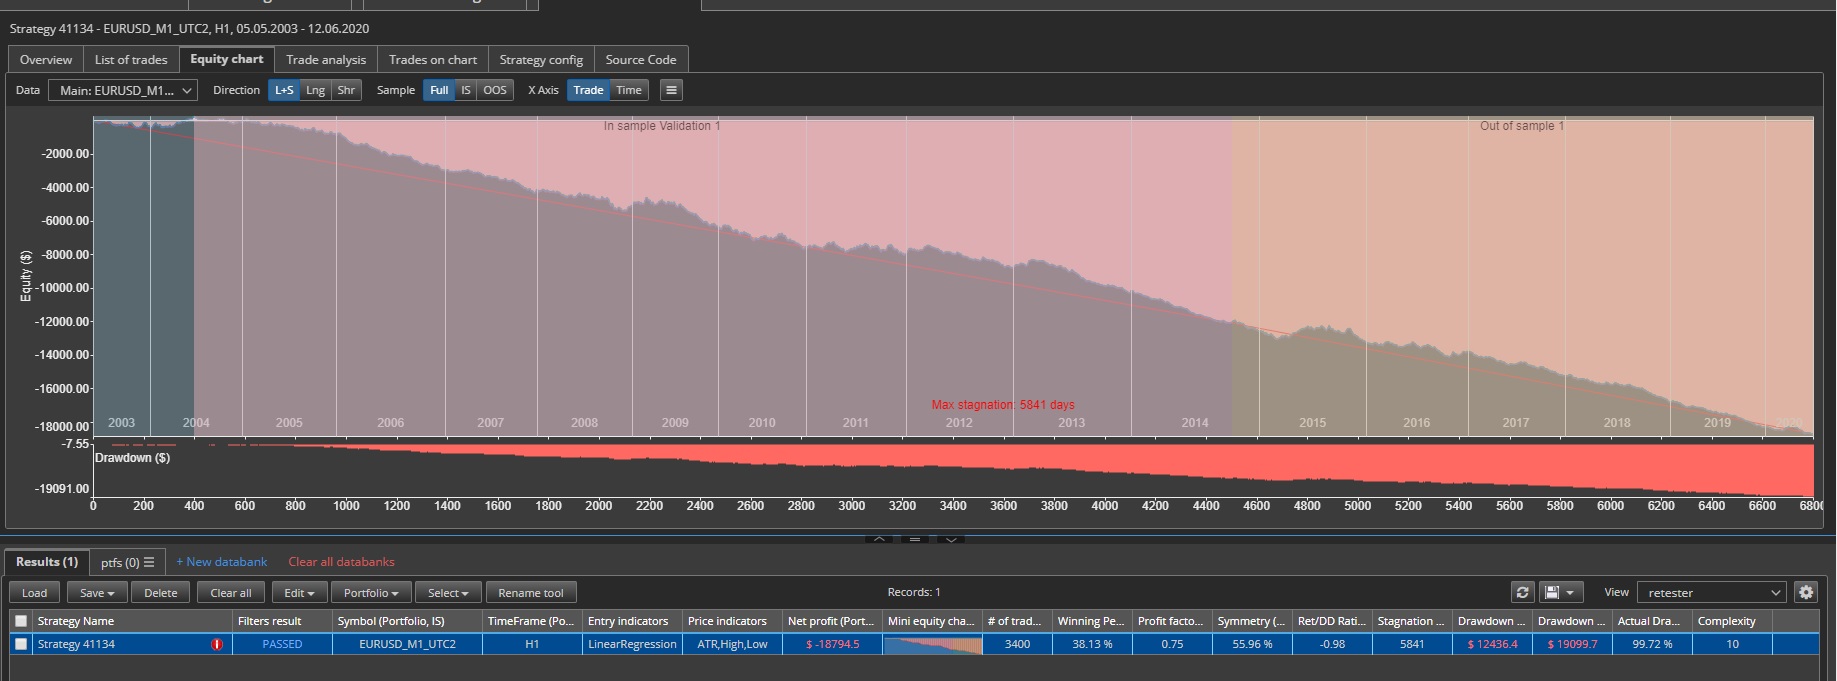
30.06.2020 20:46Yesturday , I discovered some data was missing for the EURUSD instrument. (2 000 000 instead of 5 000 000 minutes bars, the missing days was spread over 17 years )
I did redownload the data with advice of Tamas, and now I have all the data.
I will retest as soon as possible.
Yes, the missing data was probably giving trouble to Metatrader engine.
Mark, thank you very much for investigating this. I really appreciate it
Emmanuel
09.07.2020 16:12Today , I made test with all the data (5 000 000 minutes bars)
The Metatrader engine is working fine, all the results with 1 min bar and 1 hour bar are coherent.
(There is not anymore a difference between "selected timeframe only" H1 and "1 minute datatick simulation" )
© Copyright. All rights reserved. ProjectPanel.com
