129 Dev 6 Yearly Avg Return % Still Incorrect

This screenshot was generated from a strategy developed from a 10k balance. Because the YTD of any year never came close to $30,000, it makes no sense that the Yearly Avg Return is 300%. The first year produces $2242 which is a return of 22.4%. The new balance for the next year would be $12,242 and by the end of the year produced $5287 which is a return of 43.1%. The average return for the first two years would then be 32.75%. This needs to be the formula used for all the years of the portfolio. 


Year X^0 (YTD / Initial balance) + Year X+1 (YTD / Previous balance) + Year X+2 (YTD / Previous balance) ...

______________________________________________________________________________________________________________________


Number of years

Attachments
Screen Shot 2020-07-12 at 93503 AM.png
(1.06 MiB)
  • Votes +2
  • Project StrategyQuant X
  • Type Bug
  • Status Fixed
  • Priority Normal

History

KL
#1

kainc301

12.07.2020 15:49

Task created

Rr
#2

Partizanas

12.07.2020 16:04
Voted for this task.
KL
#3

kainc301

12.07.2020 21:00
It appears as if Quant Analyzer is using the correct formula for this while StrategyQuant still is not. 
KL
#4

kainc301

13.07.2020 23:07
Voted for this task.
KL
#5

kainc301

13.07.2020 23:08
Is it possible to use formula from QA as a quick fix?
TT
#6

Tamas

16.07.2020 08:47

Status changed from New to Refused

We changed the way how Avg profit and Trades per day/month/year are computed.


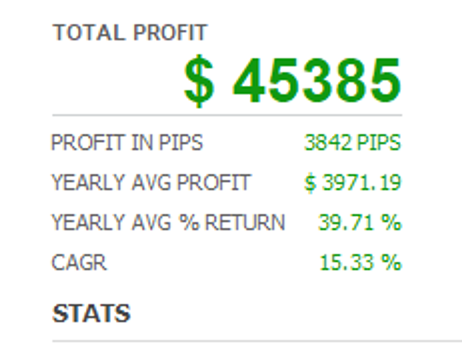
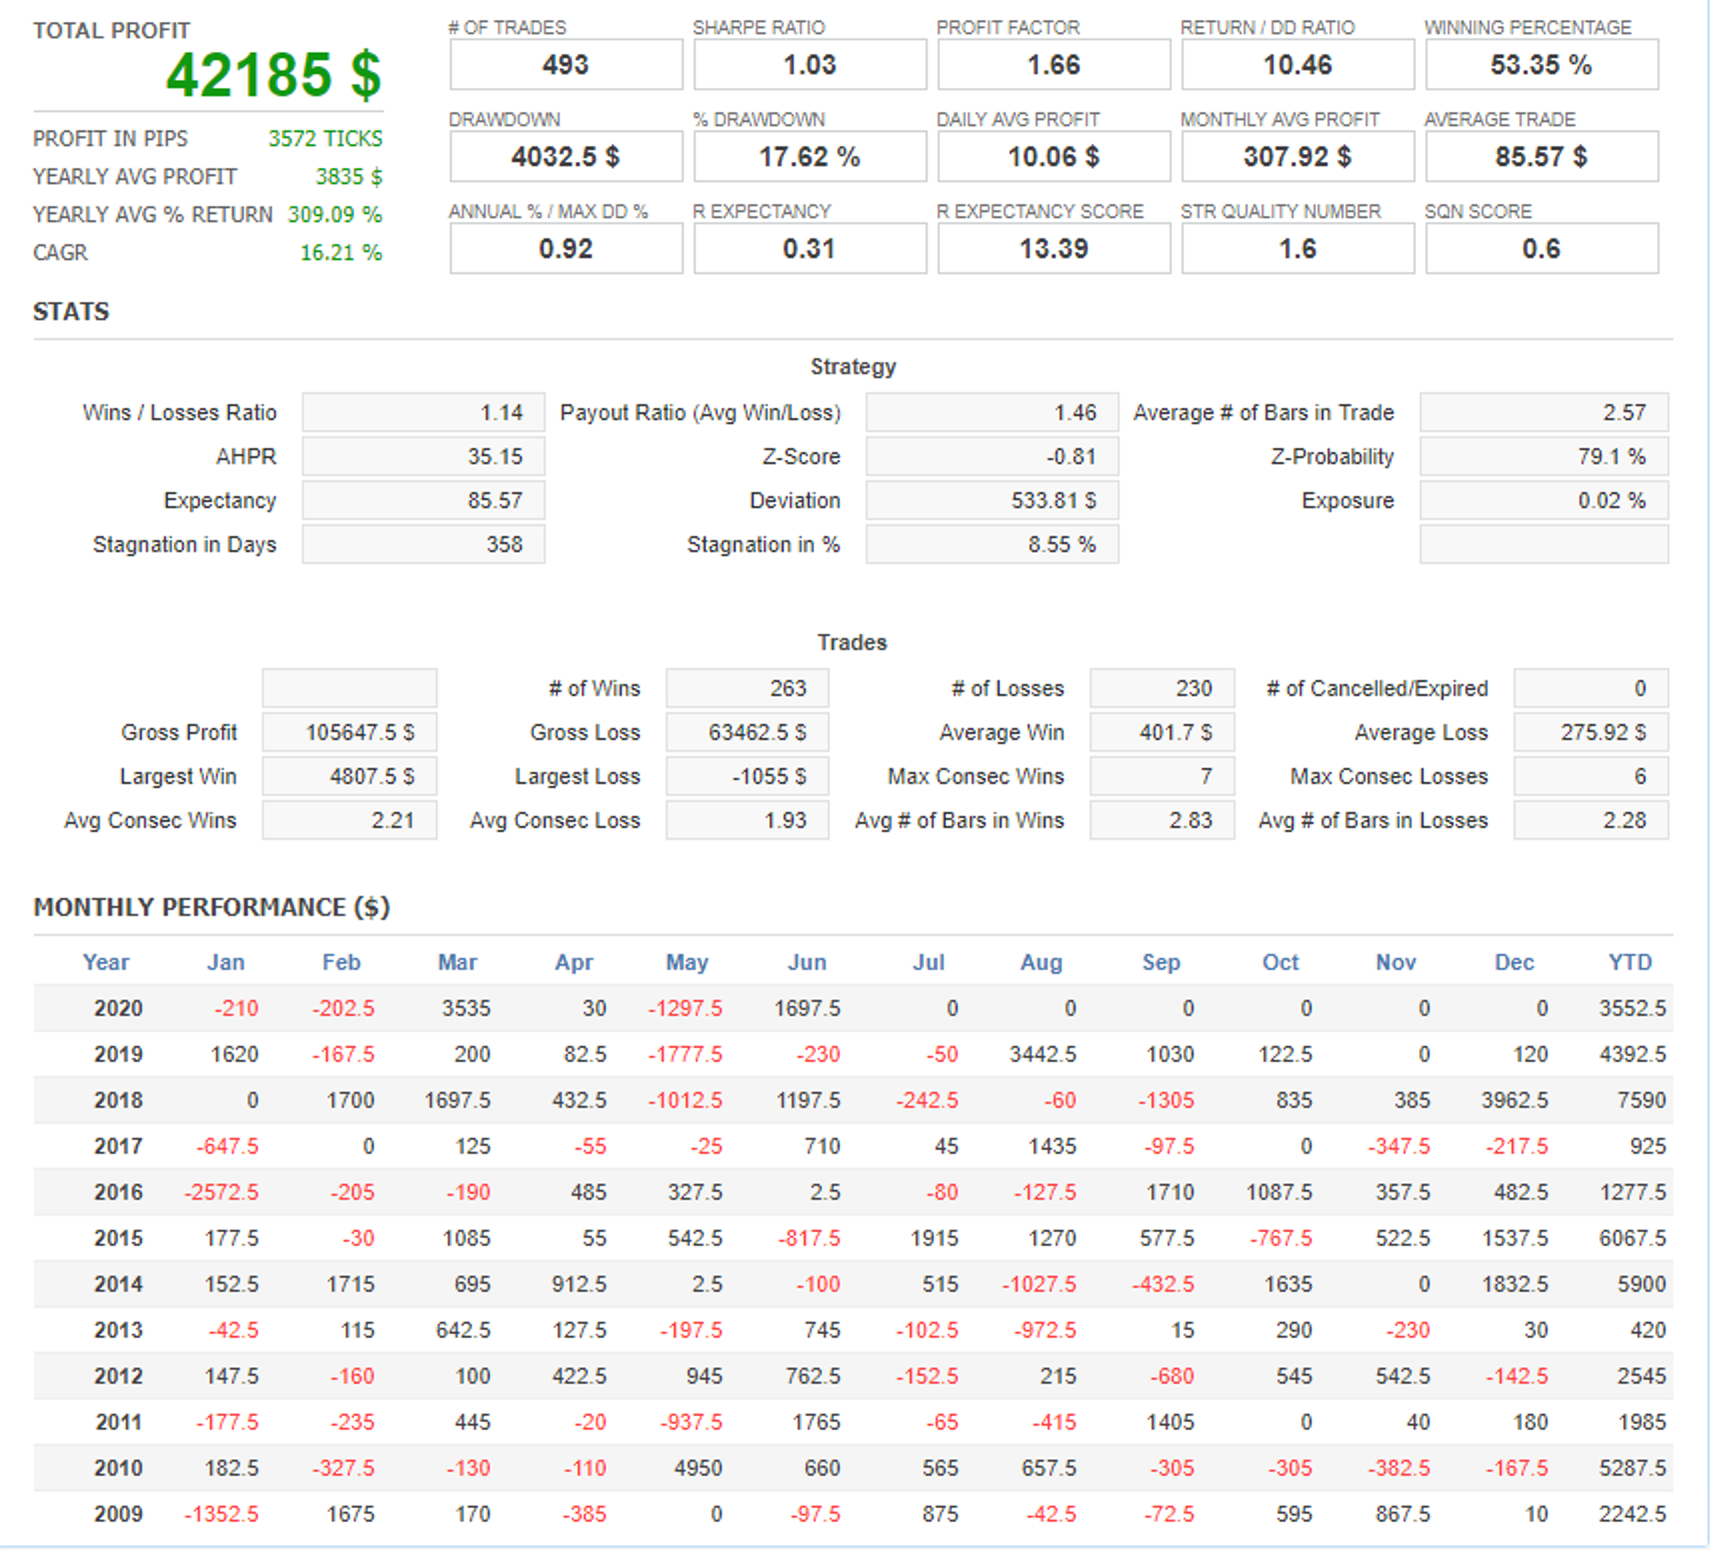
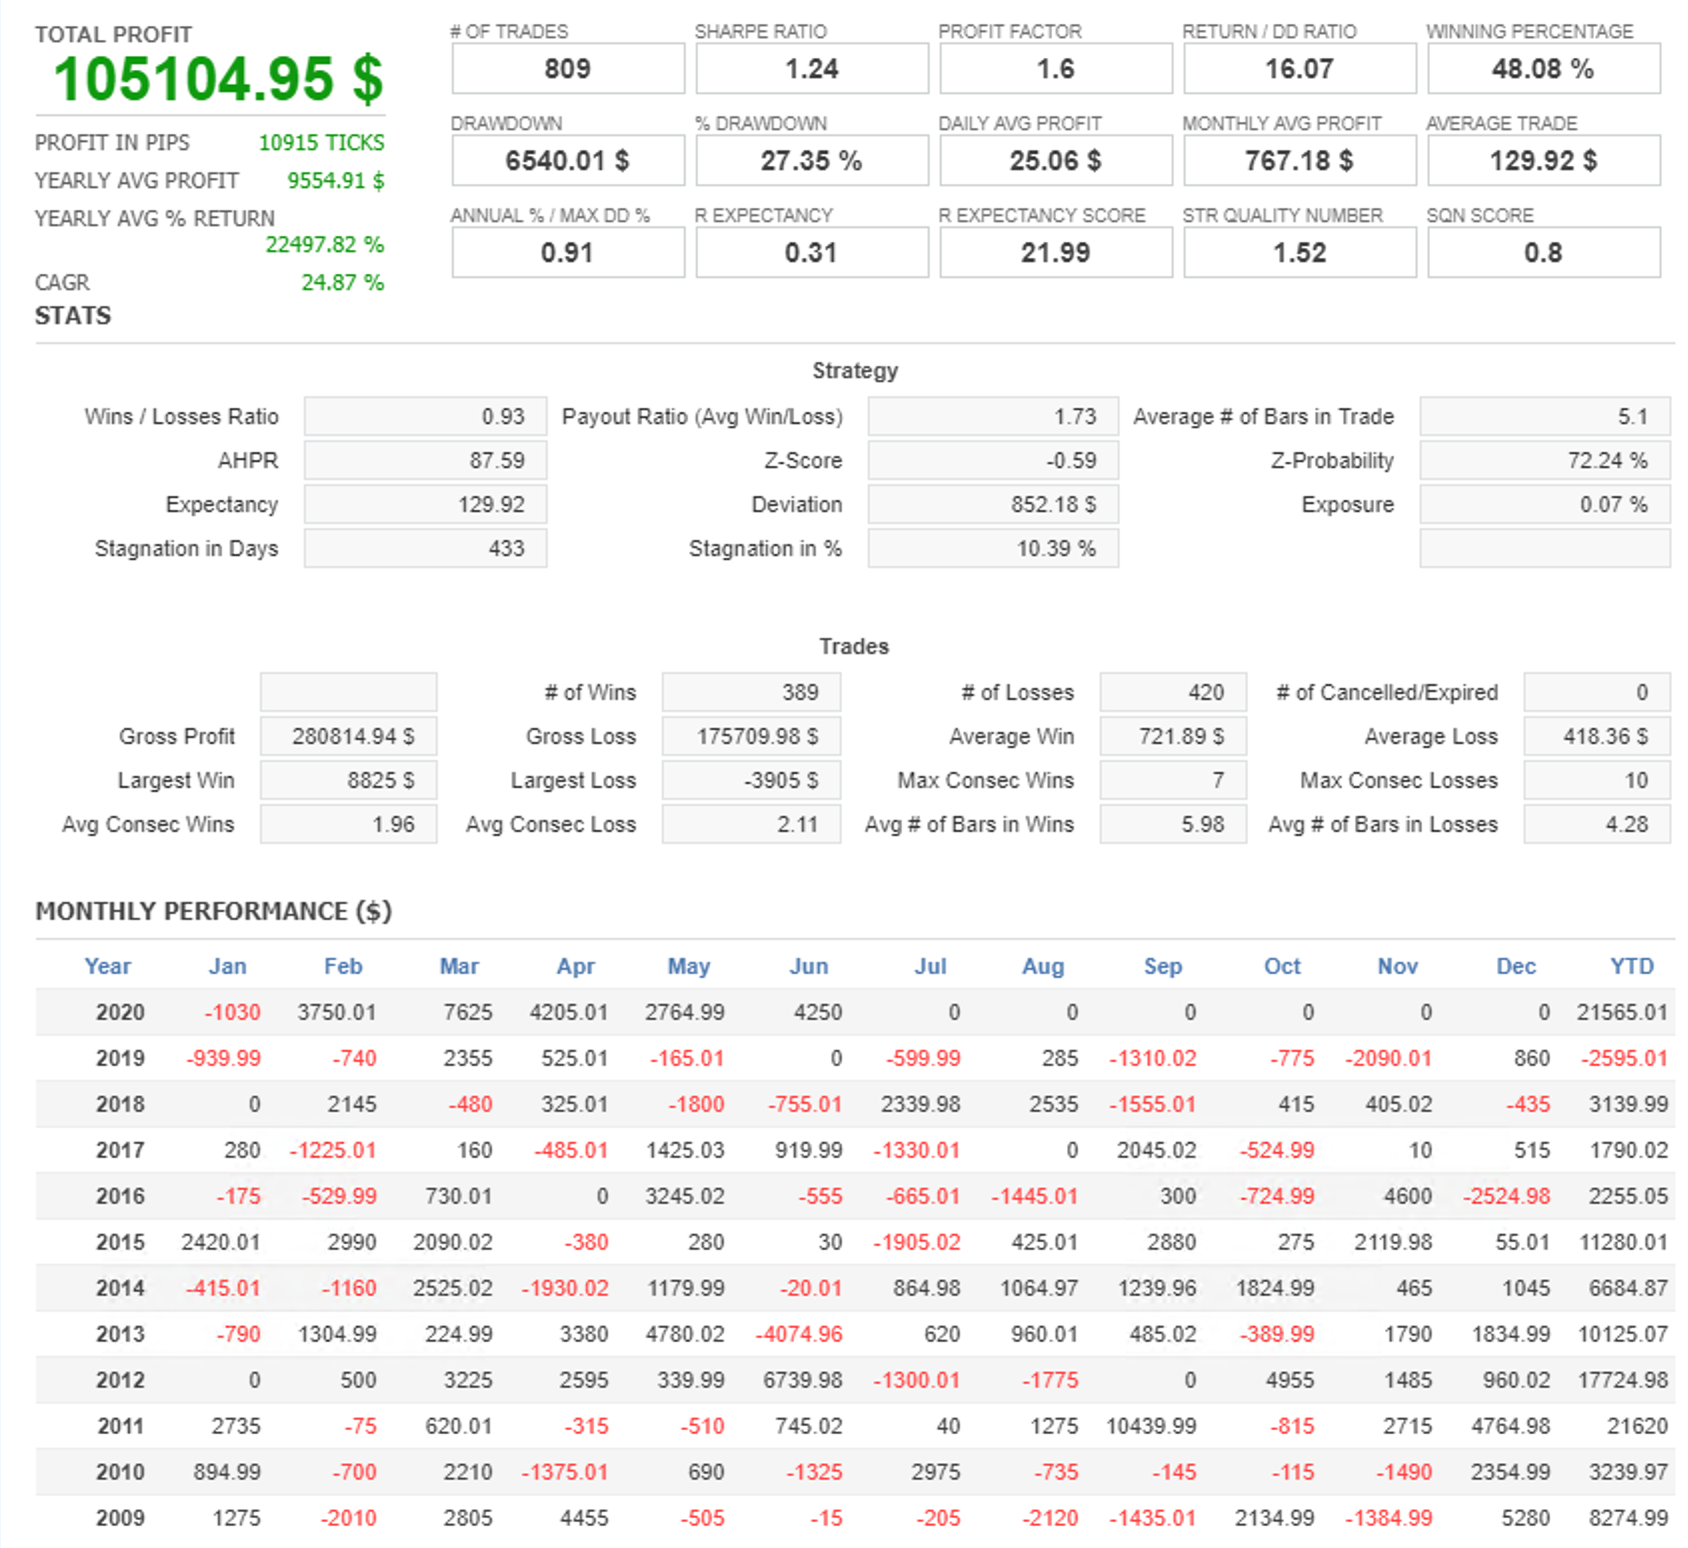
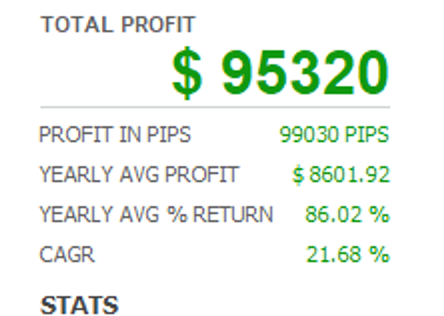
AvgPctProfitPerYear is newly calculated as NetProfitInPct / TotalDataYears instead of TotalTradingYear.

KL
#7

kainc301

16.07.2020 11:53
@Tomas, Why the change? Currently this value does not tell me anything useful. Yearly average profit % is supposed to tell me the average the portfolio grows in % every year. If my portfolio grows only 50% per year and the yearly average profit value is shown to be 2000%, this tells me nothing. Help me understand why this is a better solution or what usefulness this has because I dont see how this is making any sense. 
KL
#8

kainc301

16.07.2020 11:58

Attachment Screen Shot 2020-07-16 at 55452 AM.png added

Screen Shot 2020-07-16 at 55452 AM.png
(793.97 KiB)
Here is a perfect example. Starting balance is $10,000. Yearly average % is 22,492% per year average. Yet no where in the portfolio did the YTD ever even get close to a 22,492% gain. So what is 22,492% supposed to tell me? How is the value useful at all? I would much rather know how much in % my portfolio is growing on average each year. This value doesn't give me insight into anything. Also, 22,492% sounds like a ridiculous number to say that your portfolio is averaging is it not? I don't know how I'd be able to explain this value to anyone and have them not laugh. Please make this make sense 
KL
#9

kainc301

16.07.2020 14:21
I believe this should definitely be looked at based on my last comment. I am getting extremely high values that for yearly average % that I can't derive any meaning from at all. If I am missing what meaning I should get from this calculation, please let me know.
MF
#10

Mark Fric

20.07.2020 12:41

Status changed from Refused to Waiting for information

can you attach one examle strategy? I'll look at it one more time
KL
#11

kainc301

20.07.2020 22:31

Attachment ES_Yearly_Error.sqx added

Attachment GC_Yearly_Error.sqx added

GC_Yearly_Error.sqx
(2.10 MiB)
ES_Yearly_Error.sqx
(1.34 MiB)
It happens on every strategy I make but the value gets more pronounced the higher the net profit of the strategy is. All my strategies only use constant risk for these tests.
KL
#12

kainc301

20.07.2020 22:39

Attachment Screen Shot 2020-07-20 at 43442 PM.png added

Attachment Screen Shot 2020-07-20 at 43422 PM.png added

Screen Shot 2020-07-20 at 43442 PM.png
(82.10 KiB)
Screen Shot 2020-07-20 at 43422 PM.png
(79.89 KiB)
When you load up the same strategies into Quant Analyzer, you get the correct values for yearly average return %. In SQX they are in the hundreds - thousands % range. These screenshots are of the same strategies but in QA instead of SQX. QA appears to have the formula correct when compared to SQX. No idea why but the difference is night and day.


MF
#13

Mark Fric

21.07.2020 12:33

Status changed from Waiting for information to Fixed

I checked it and you are right, there was a mistake how we computed Avg Yearly Percentage Profit. I fixed it.


KL
#14

kainc301

21.07.2020 19:22
Thank you Mark!

Votes: +2

Drop files to upload

or

choose files

Max size: 5MB

Not allowed: exe, msi, application, reg, php, js, htaccess, htpasswd, gitignore

...
Wait please