SQX equity curve and TS trade history not match!
Thank you for your kind cooperation.
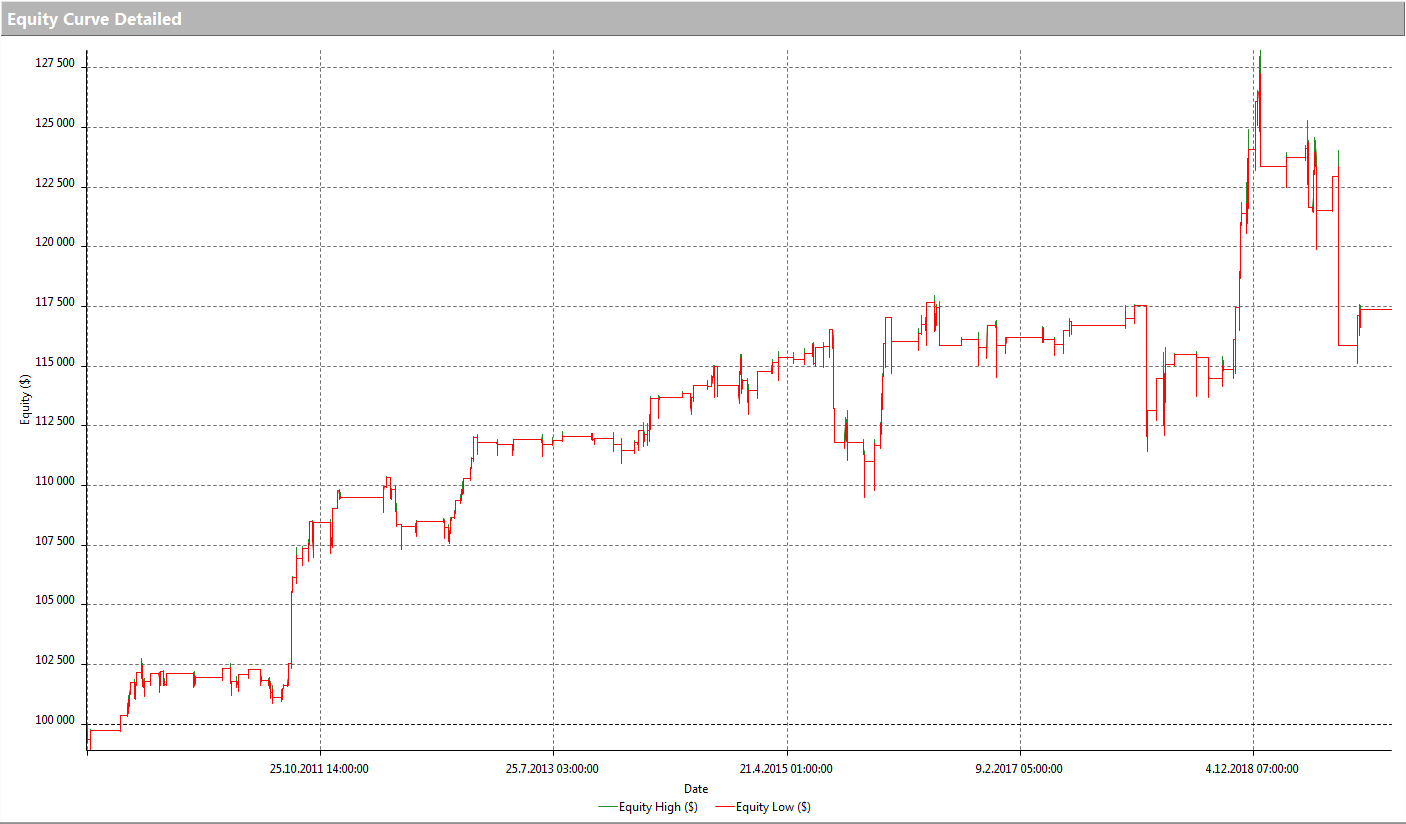
there is very serious problem in Tradestation.
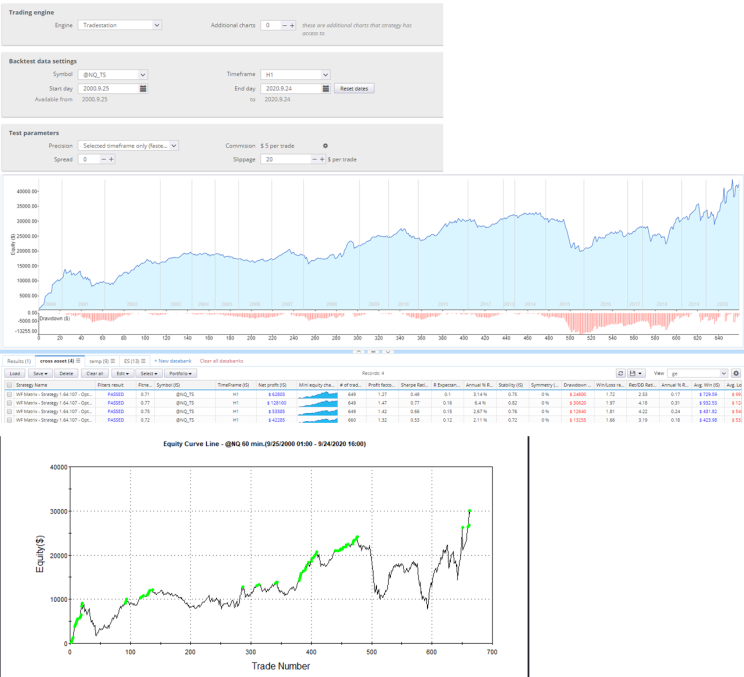
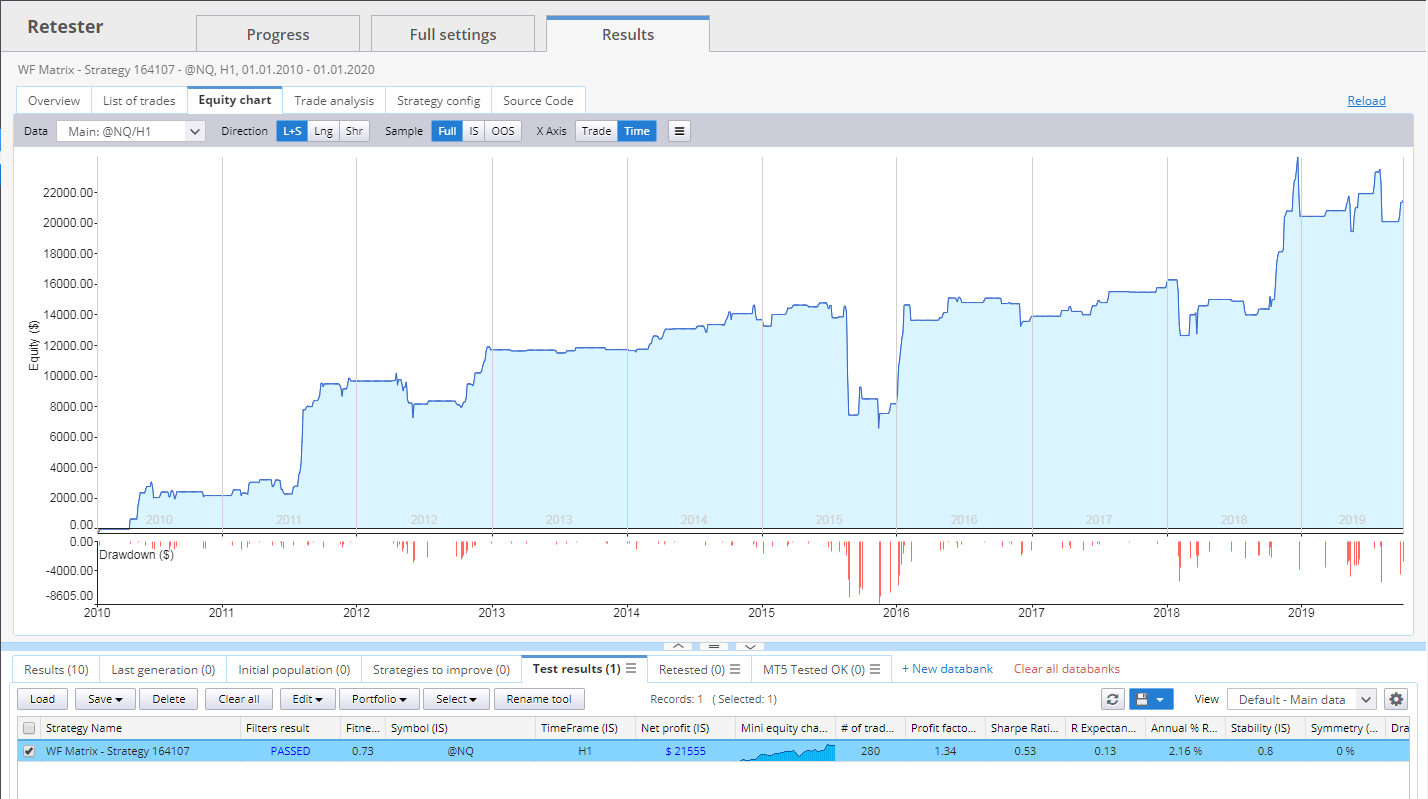
The Equity curve in SQ and the curve in TS do not match.
I'm not newbie.
SQ's market data is based on the data obtained from TS.
This is an obvious bug.
and it must be resolved as soon as possible.
-
Votes +4
-
Project StrategyQuant X
-
Type Bug
-
Status Fixed
-
Priority Normal
History
Tomas Brynda
14.10.2020 09:04Status changed from New to Fixed
Attachment equity_TS.png added
Attachment screen.png added
Attachment sq_equity.png added

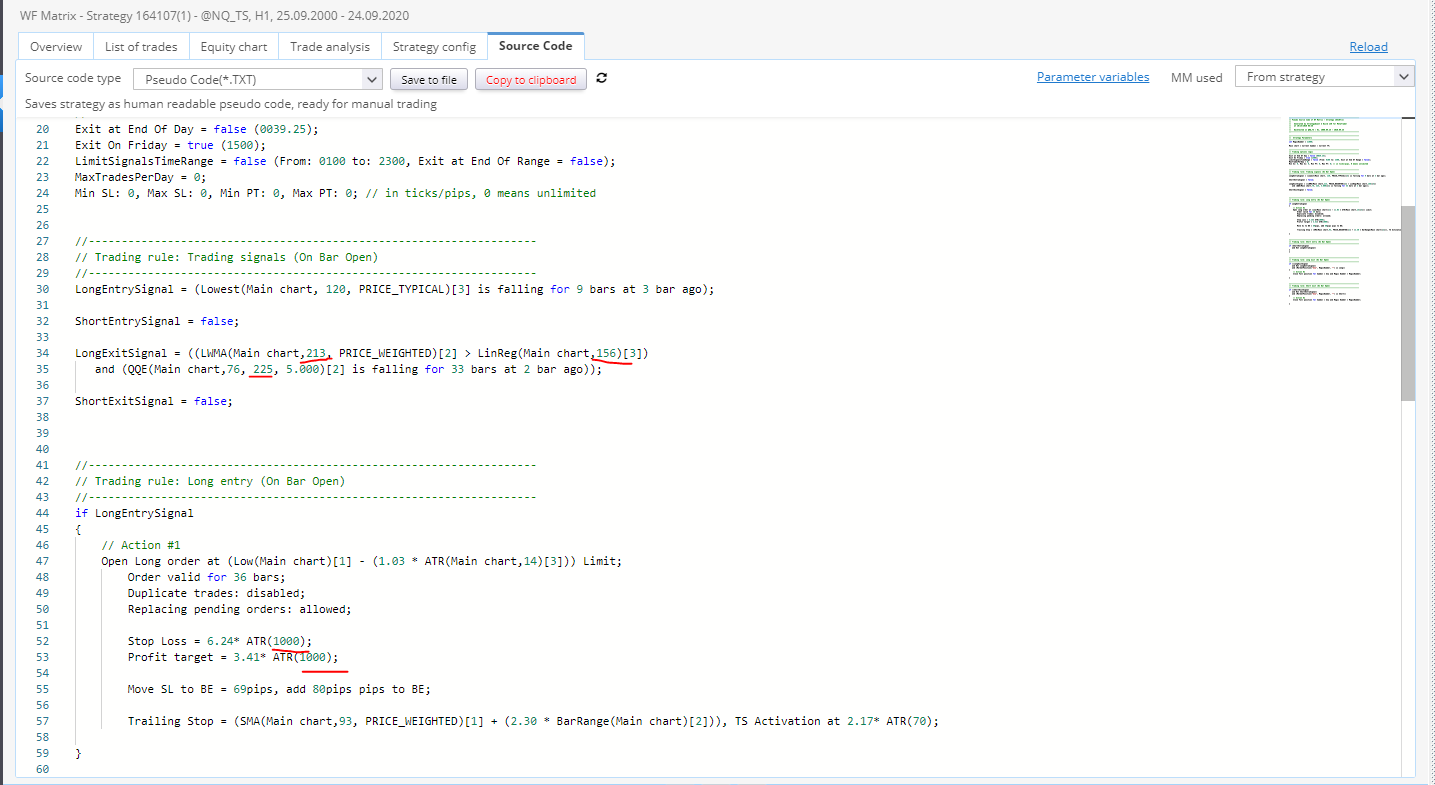
I must point out that your strategy uses a HUGE periods in indicators. Take a look at the screenshot - it uses ATR with period 1000.
It takes very long for the indicator values to stabilize and values that high don't even make sense.
In my case TS doesn't even recognize the proper number of reserved bars. It allows me to perform a backtest even with a number 400.
I think you should modify your build setup and limit the maximum indicators period numbers.
Nevertheless I was able to get a very similar results.
In B129 there were a few problems with EasyLanguage source code, which are now fixed.
Best regards,
Tomas
© Copyright. All rights reserved. ProjectPanel.com
