MonteCarlo - Randomize History Data (New ways!)
First of all i dont know how exactly does this feature in MonteCarlo works,

-
Votes +3
-
Project StrategyQuant X
-
Type Feature
-
Status Refused
-
Priority Normal
History
Karish
30.09.2020 17:58I wanted to point out that on Version 2 of the right sided screenshot the 60% for that example would not only be +60% but 60% means 200 random simulations of +60% & -60% of those points.
Thanks.
Insanity82007
01.10.2020 00:15Attachment Probability.png added
Attachment M5.png added

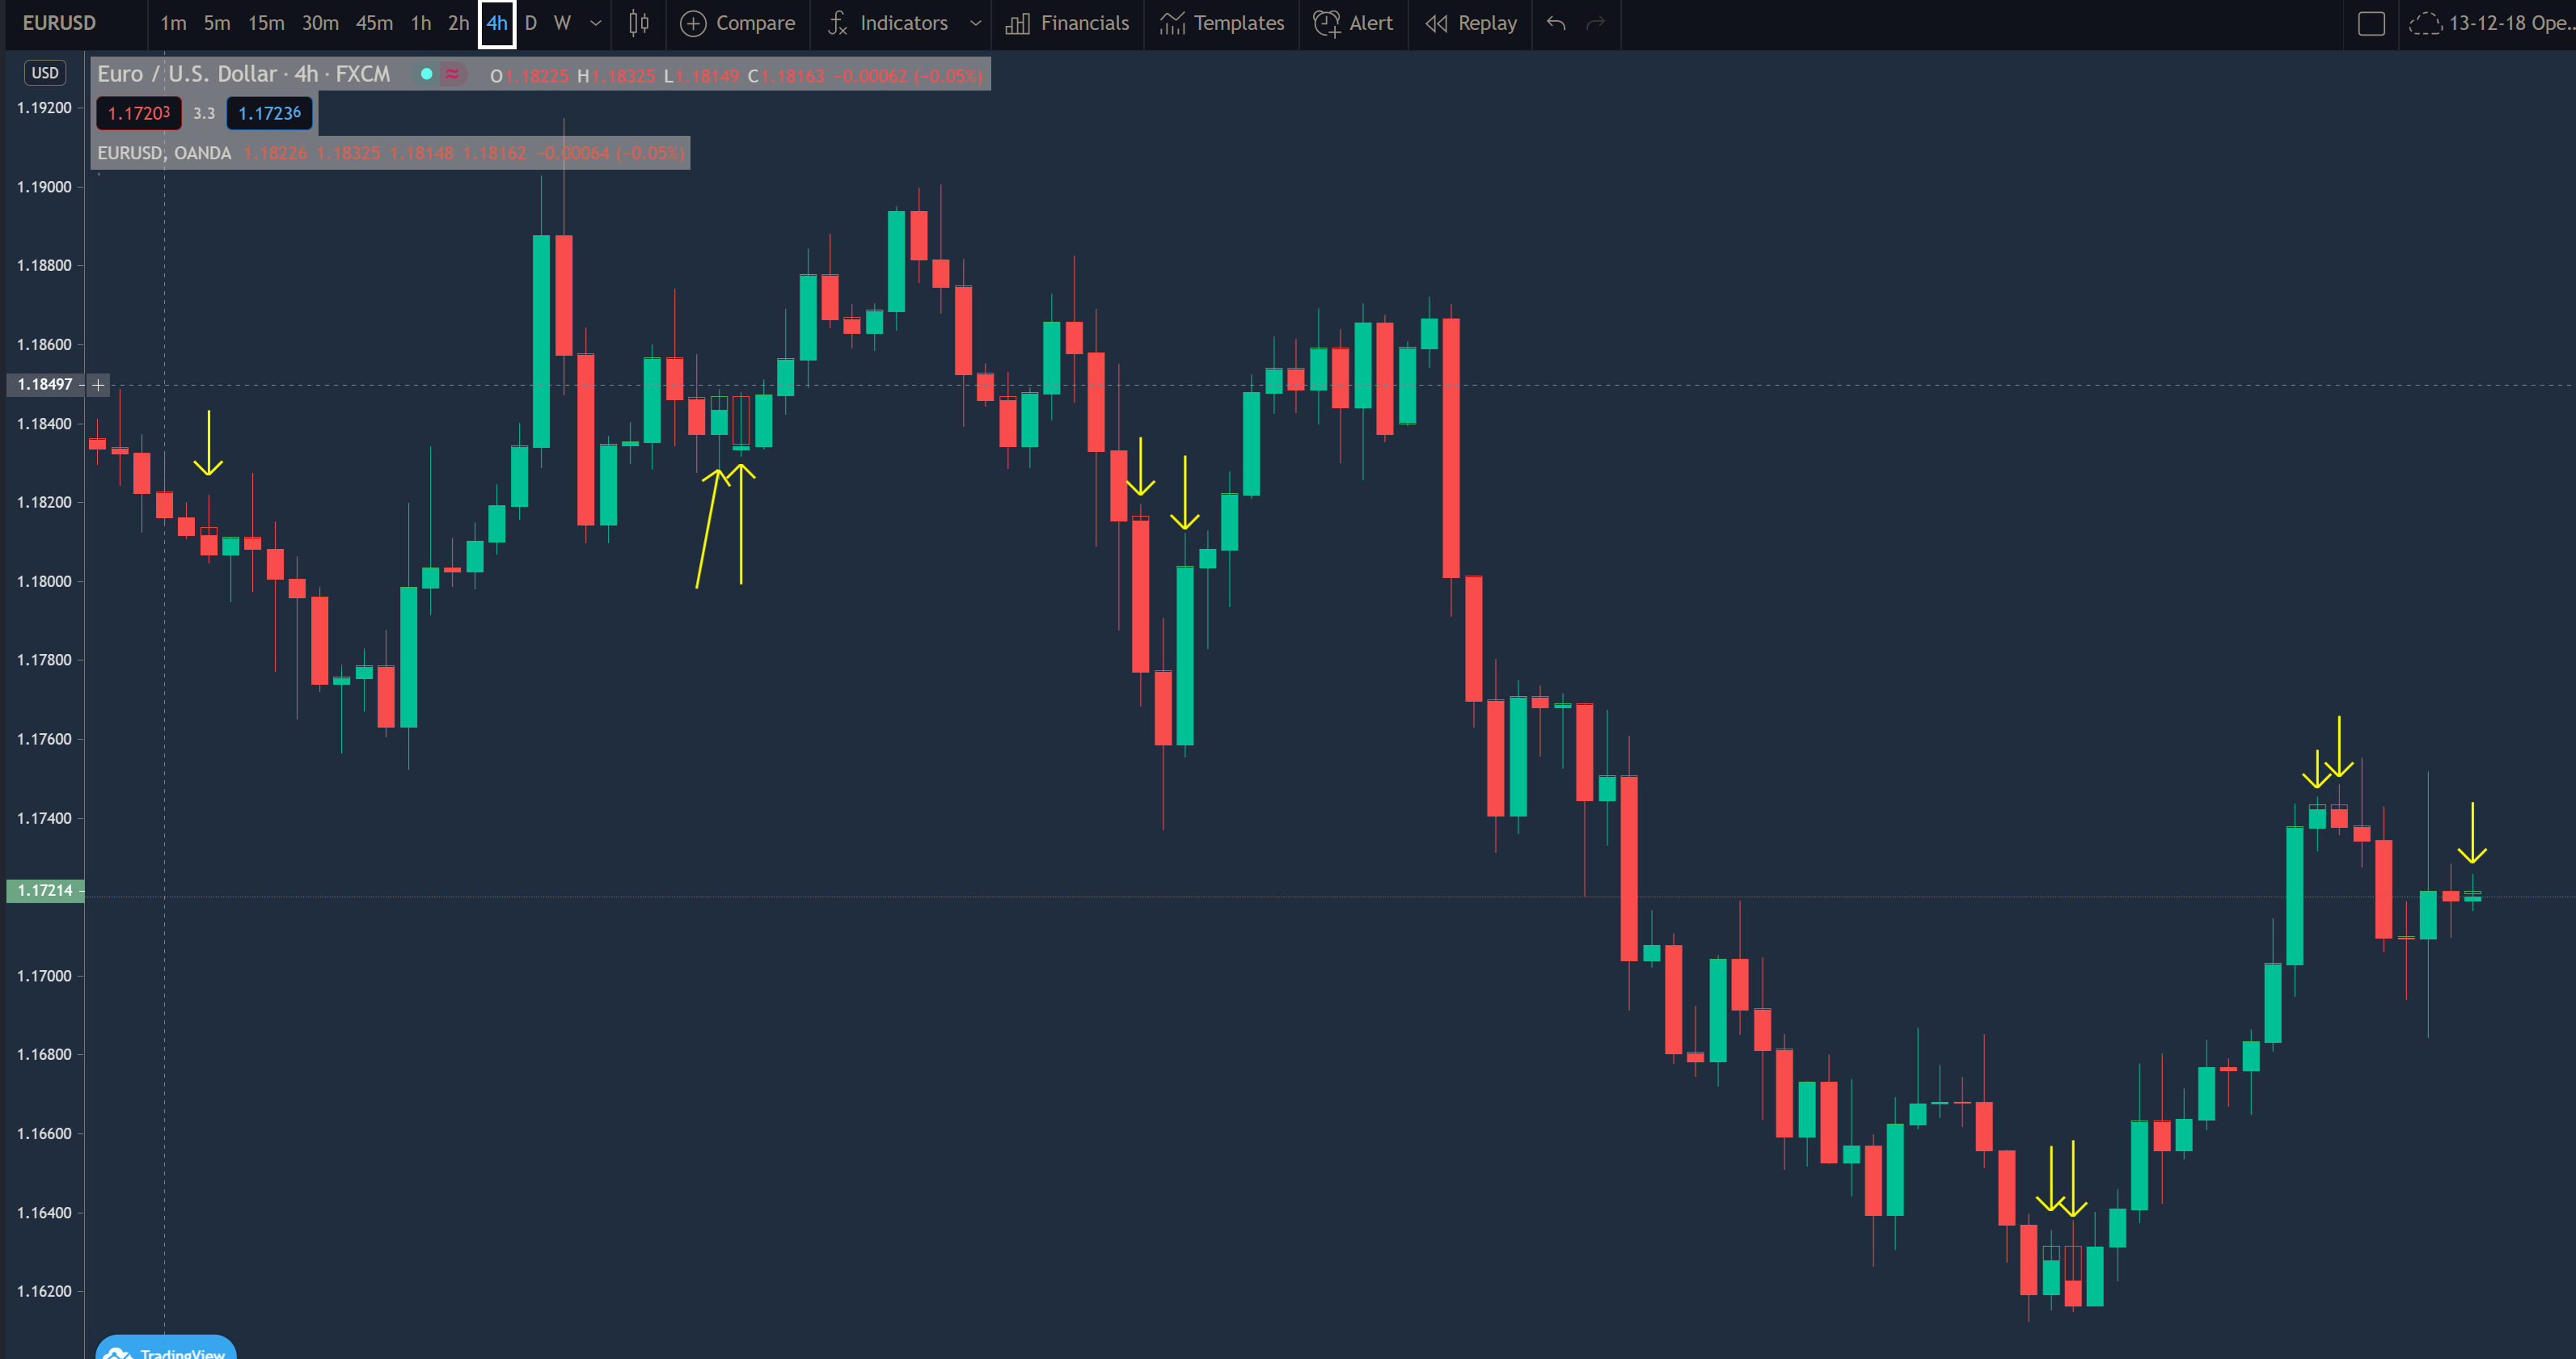
Attached is a comparison between FCXM and Oanda on H4 timeframe (highlighted with arrows). Full bars are FCXM and superimposed hollow bars are Oanda.
I've also attached an image with M5 (without arrows) that shows far more bars with a lot more differences.
I've also checked the wicks, but these are very hard to display in a screenshot, but they are almost identical on higher timeframes with a lot more volatility on lower timeframes.
Interestingly though on the lower timeframes, while I was scanning the wicks through historical data, I found that during peak trading (London / NY for FX) that bars and wicks were nearly all identical and that most of the variances occurred during off peak trading.
Mark Fric
14.10.2020 14:59Status changed from New to Refused
If you'll set it to less than 100% then the given price will be not changed.
The only thing you propose is to set range independently for O,H,L,C, I don't see it being that useful.
© Copyright. All rights reserved. ProjectPanel.com
