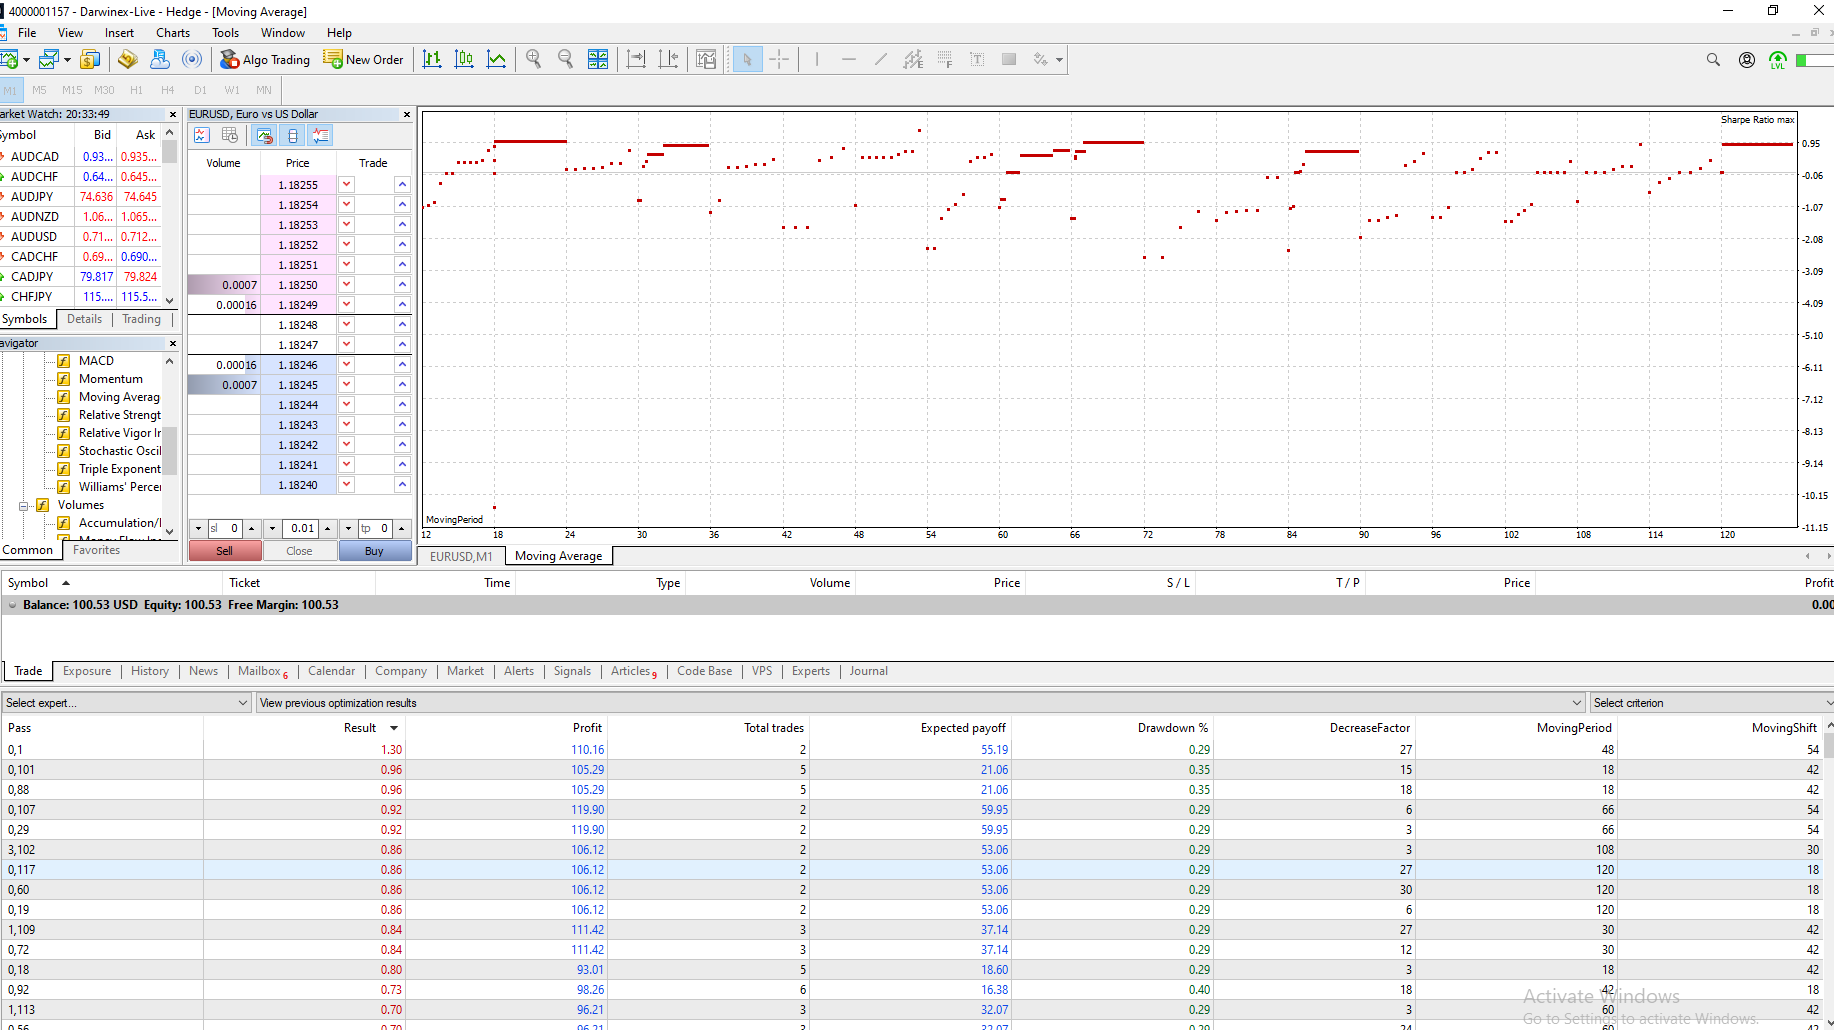
Scatter chart / 1D chart for optimization profile
1 chart per variable. X axis are the values tested of the variable. Y axis are the results of the optimizations.
Here is a screenshot of mt5
Here is a screenshot of mt5
-
Votes +1
-
Project StrategyQuant X
-
Type Feature
-
Status New
-
Priority Normal
Votes: +1
© Copyright. All rights reserved. ProjectPanel.com
