(B132 Final) Additional Market Equity Curves Poor Formatting - Not Fixed
Referring to my previous bug report which was marked as fixed:
https://roadmap.strategyquant.com/tasks/sq4_8162
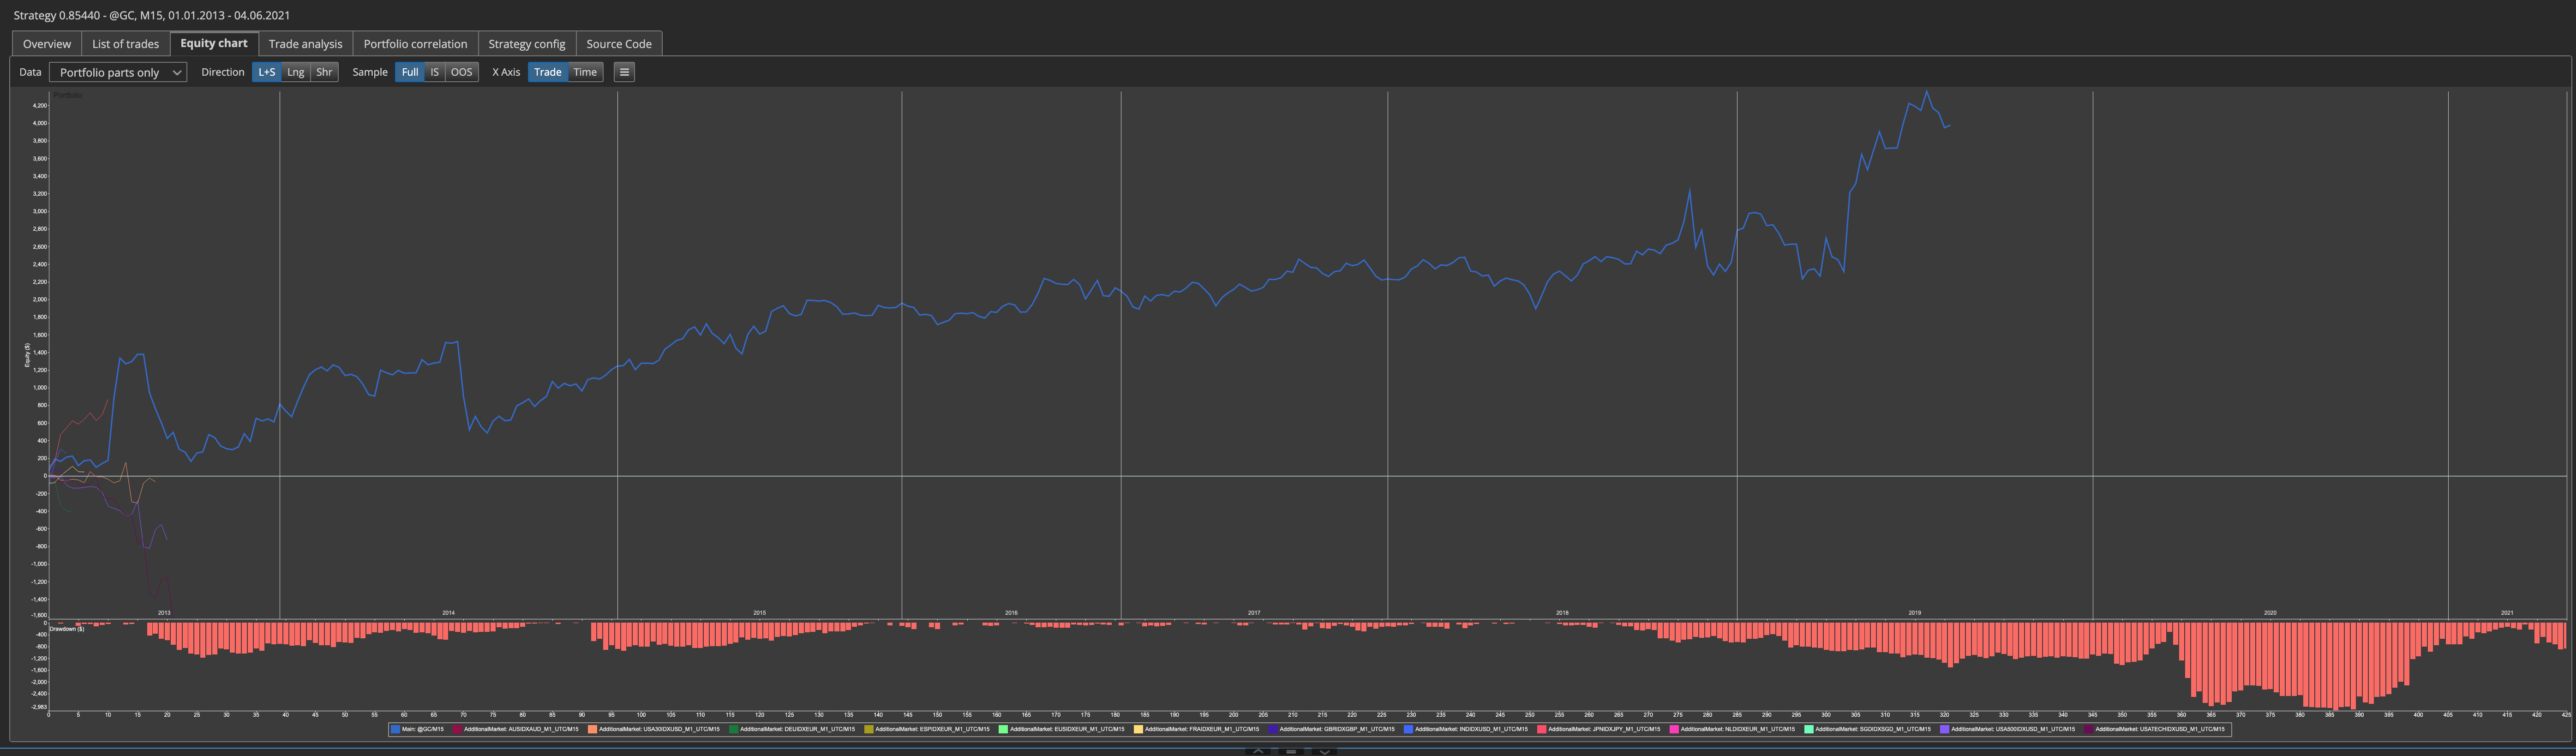
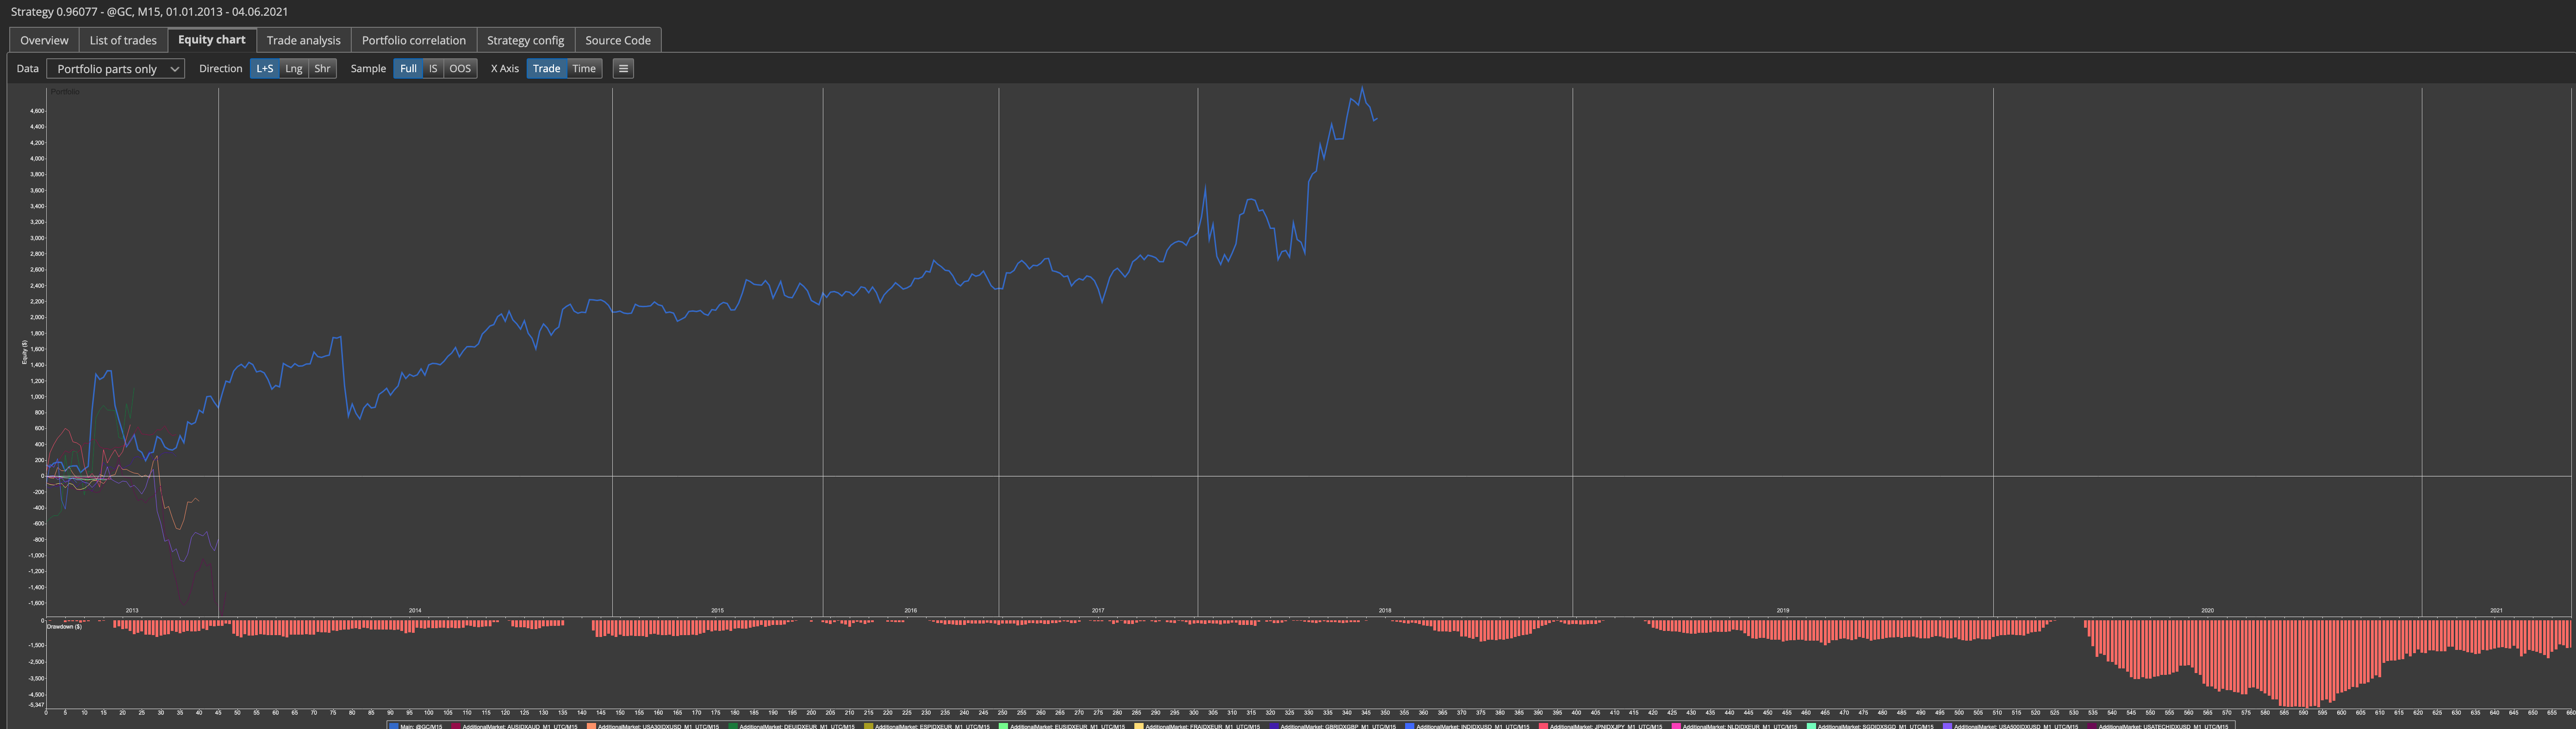
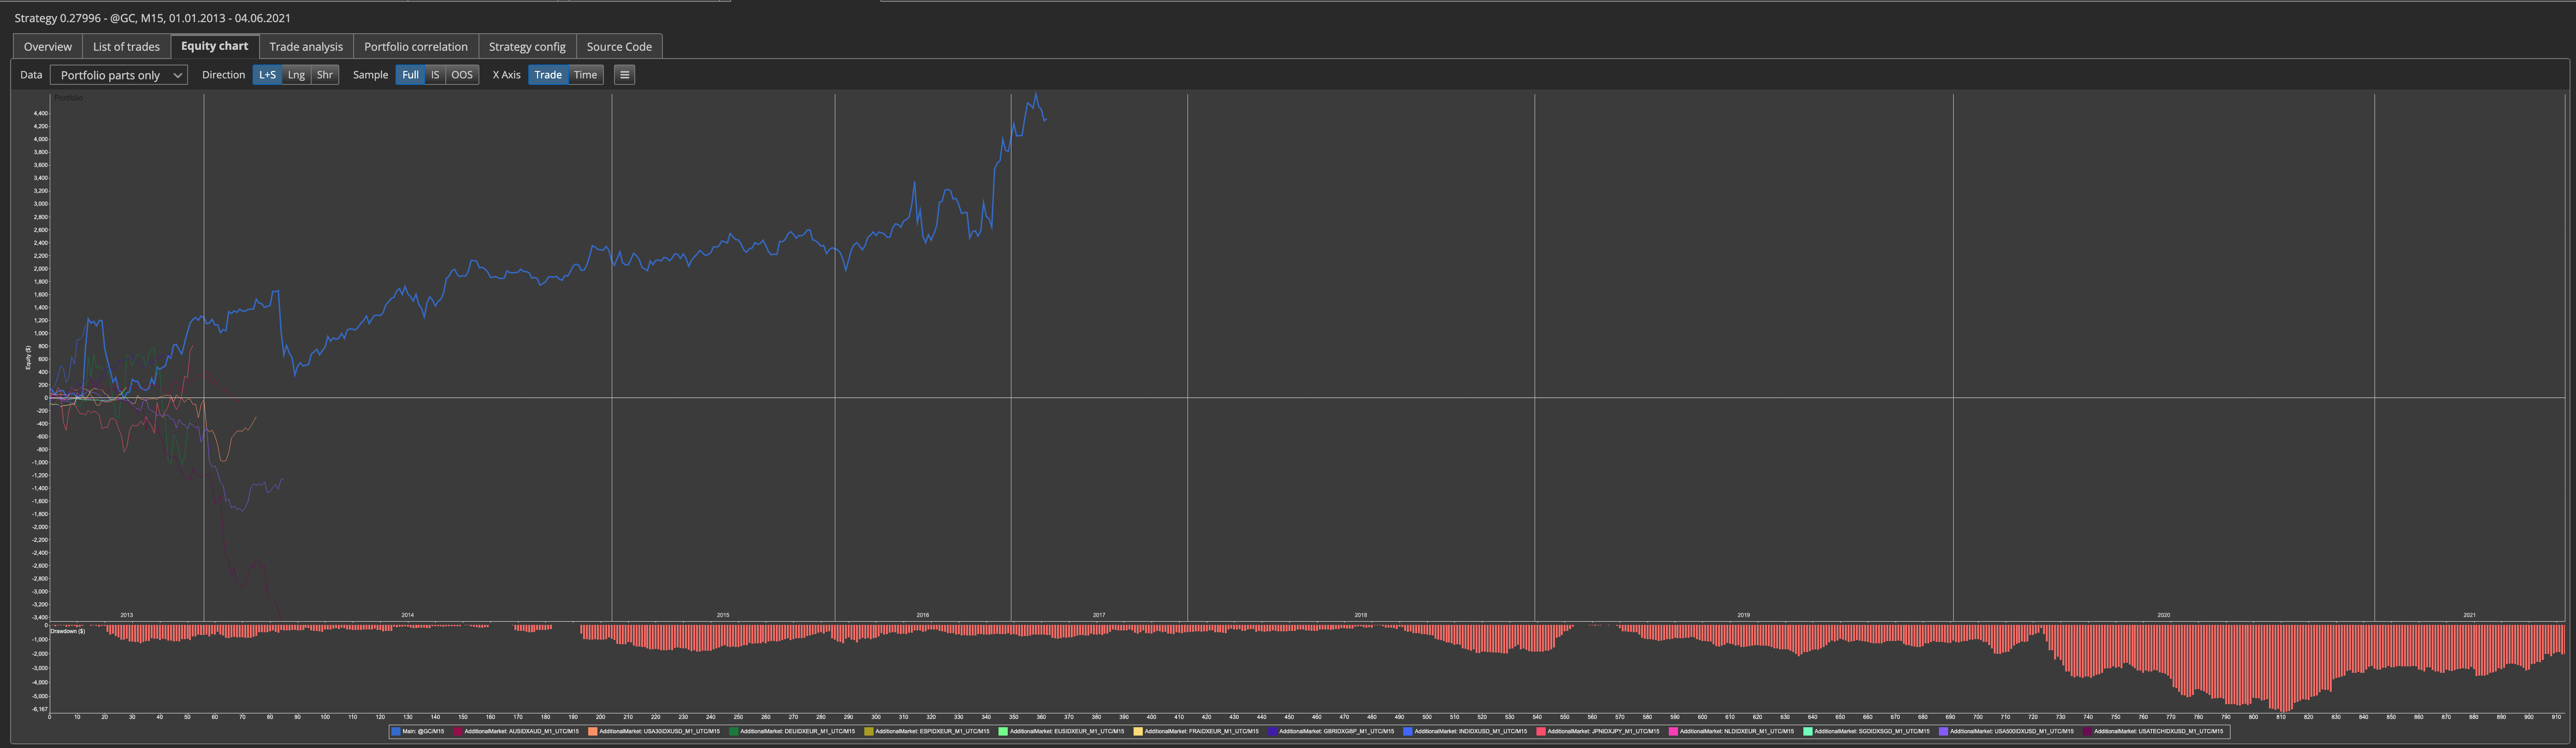
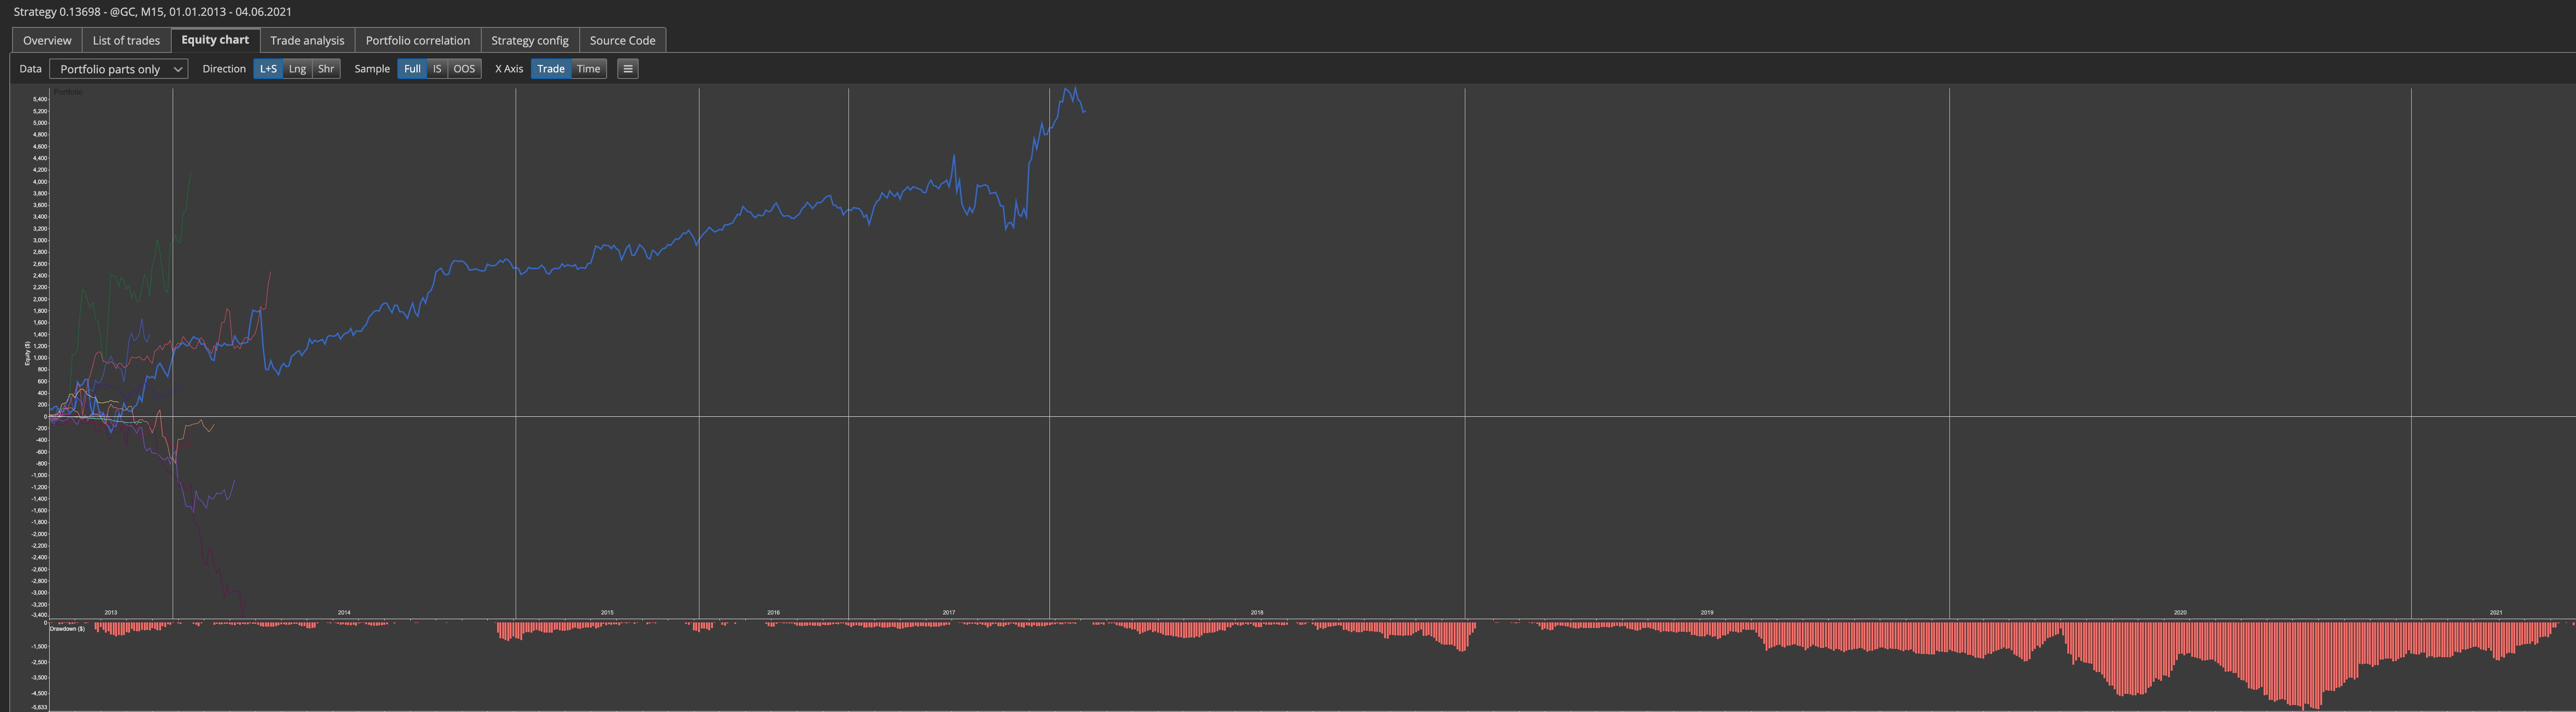
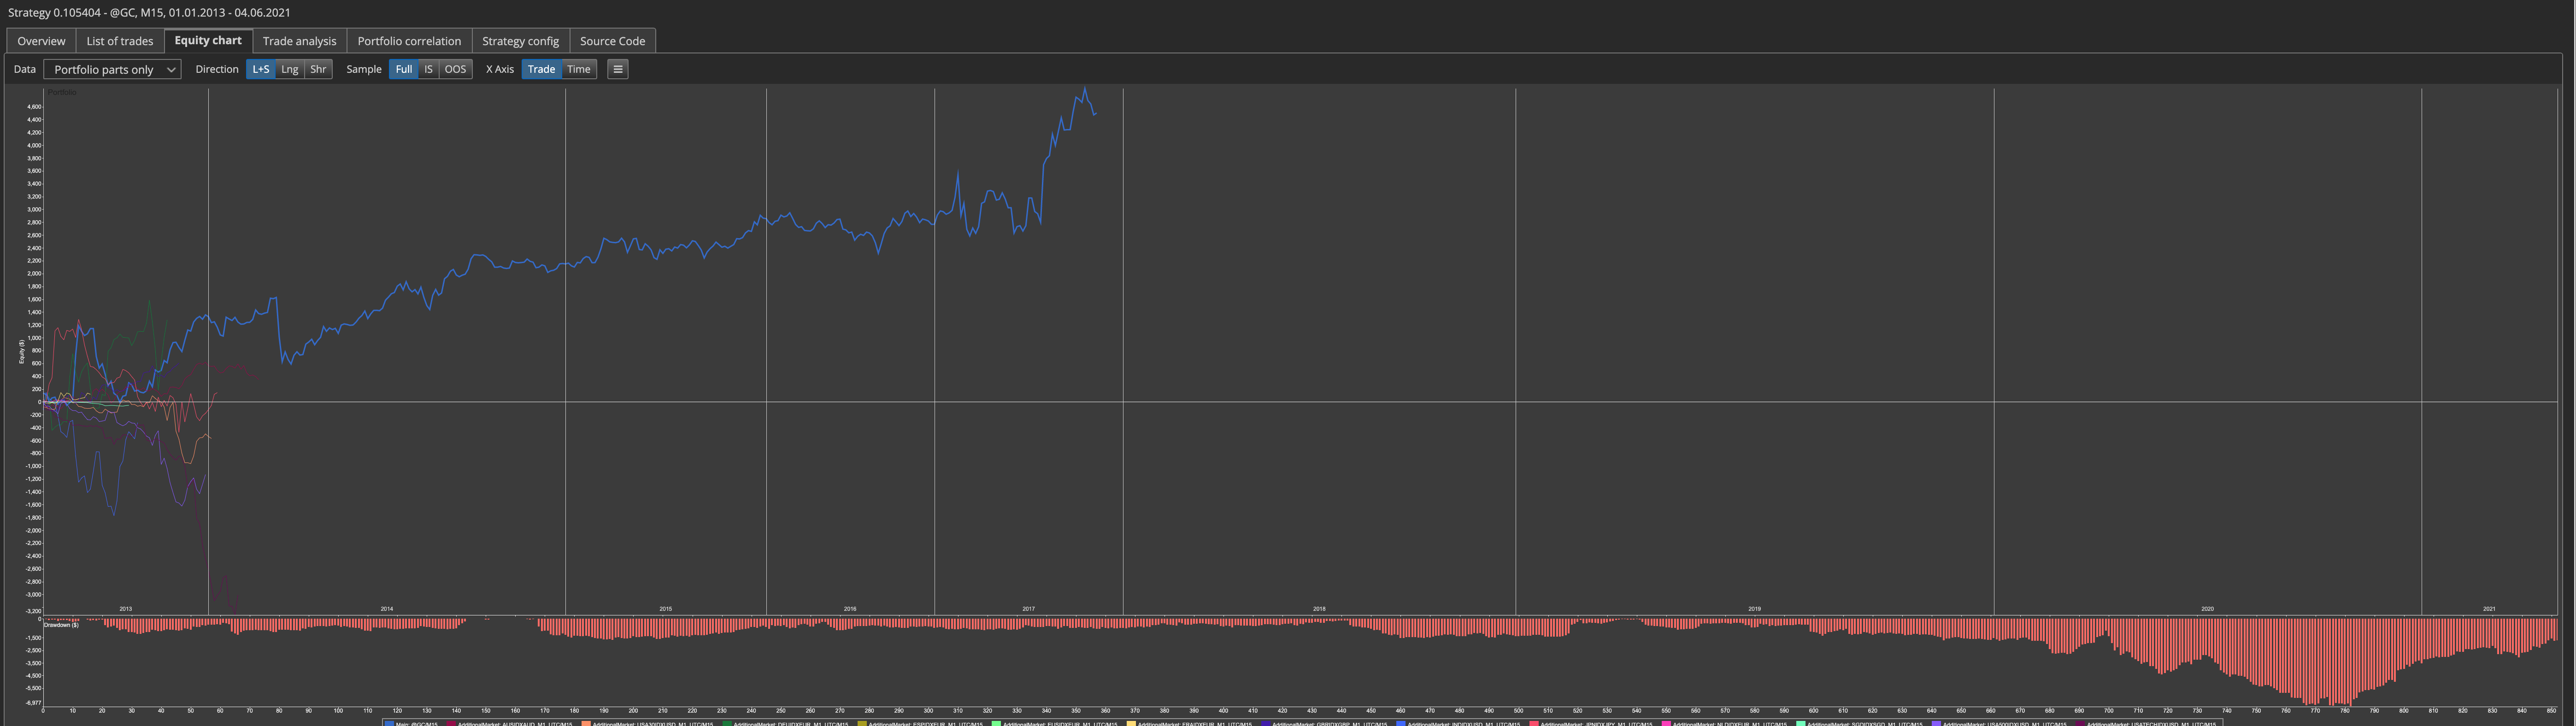
In my original bug report I reported that the formatting was badly skewed to the right. After the "fix" it is now opposite and is all badly skewed to the left. See screenshots. Its actually worse than it was before now.
B132 Final build Mac version
Attachments


-
Votes +1
-
Project StrategyQuant X
-
Type Bug
-
Status Refused
-
Priority Normal
History
JH
NS
TT
Tamas
28.06.2021 09:06Status changed from In progress to Refused
Hello, it is not a bug.
With X Axis == Trades you can see how many orders has each subresult exactly ... no portfolio line displayed ("Portfolio parts only")!!!!.
Turn off DD subchart because it is displayed for the whole portfolio.
I recommend for Portfolio data always switch X Axis to Time line.
Votes: +1
© Copyright. All rights reserved. ProjectPanel.com
