Statistical variation in Standard deviation : Equity Chart and Filters With Standard deviation
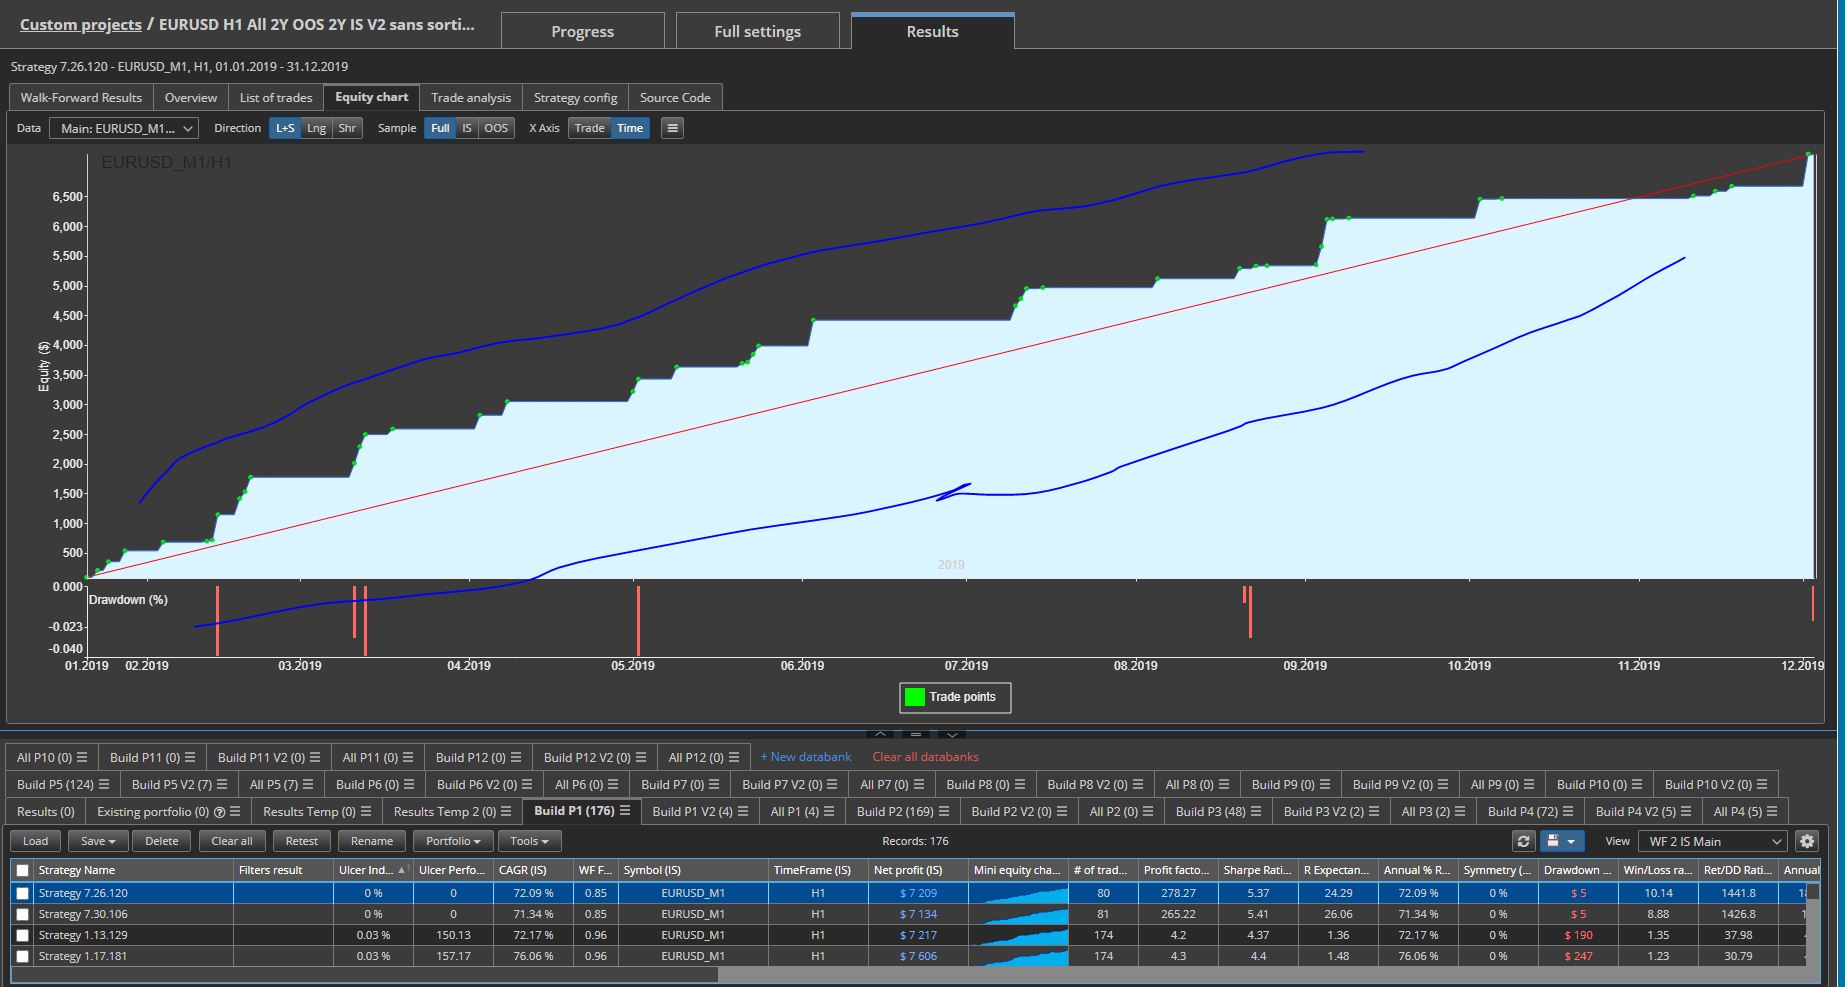
Usually the worst strategies are the perfect overfitting strategies. These strategies have a straight Equity Chart with the most rigorous filters
These strategies are a perfect recipe for disaster on the next few trades. (See capture too perfect attached)
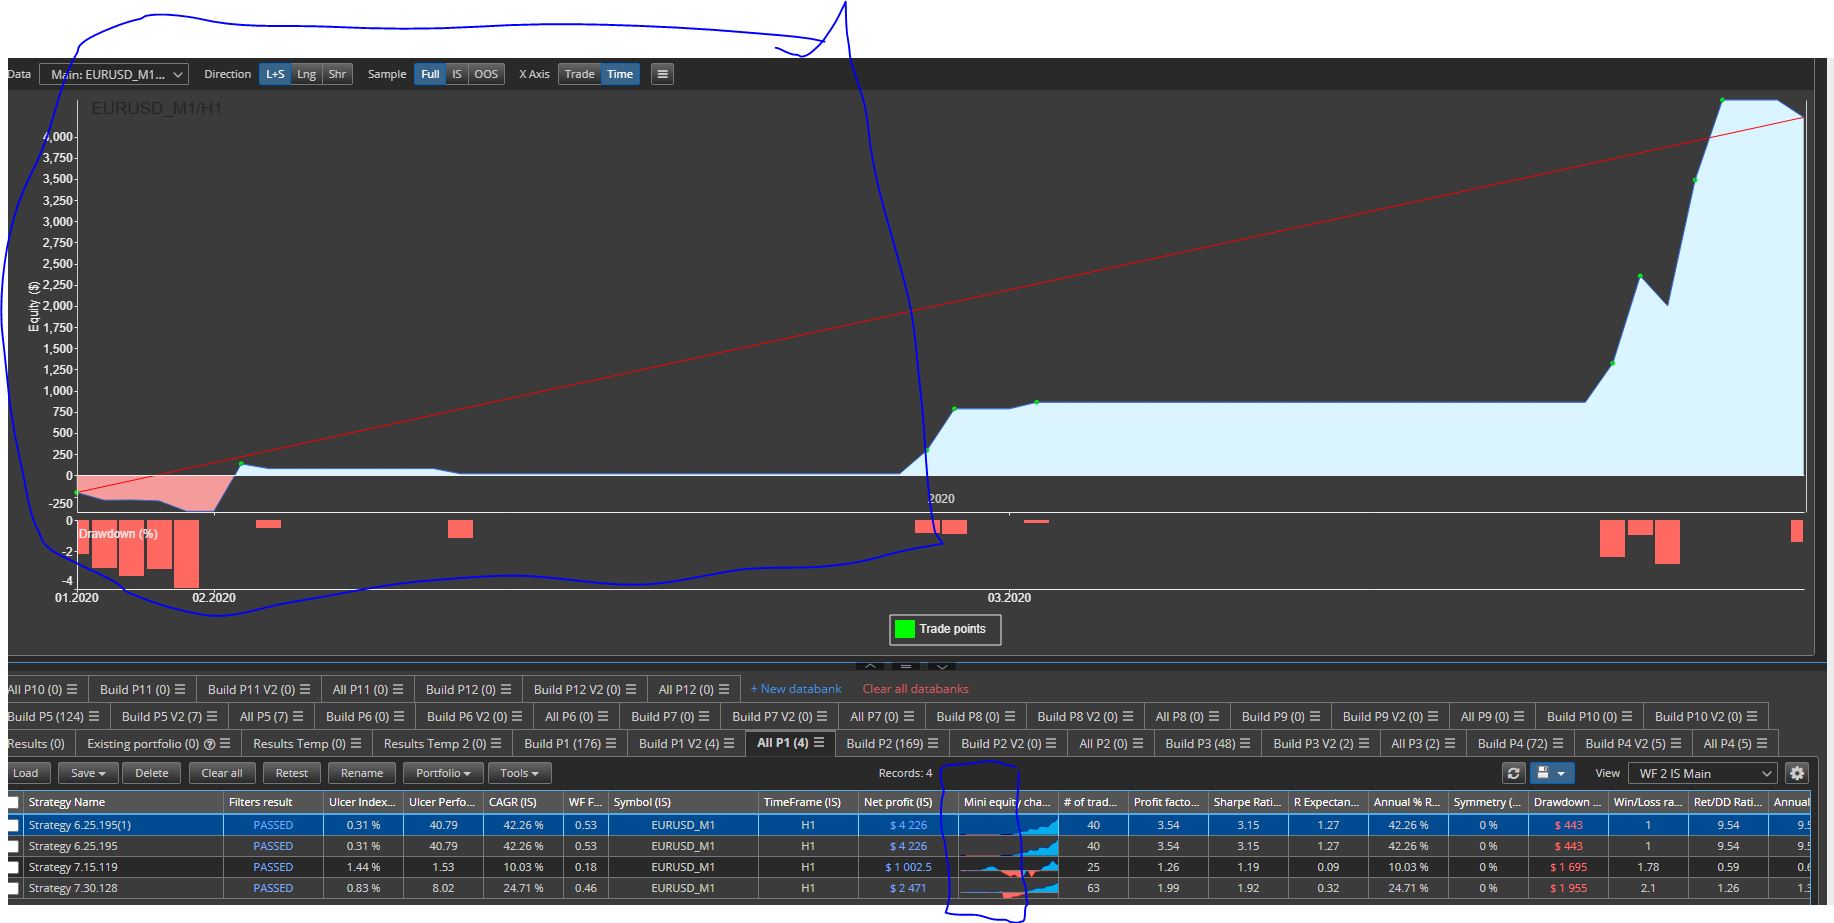
A better way to see if a strategy may be interesting, is to see if its Equity stay within a Standard Deviation or in a Bollinger Band.
In this case , you can choose a good strategy with its natural variation, this is much better.
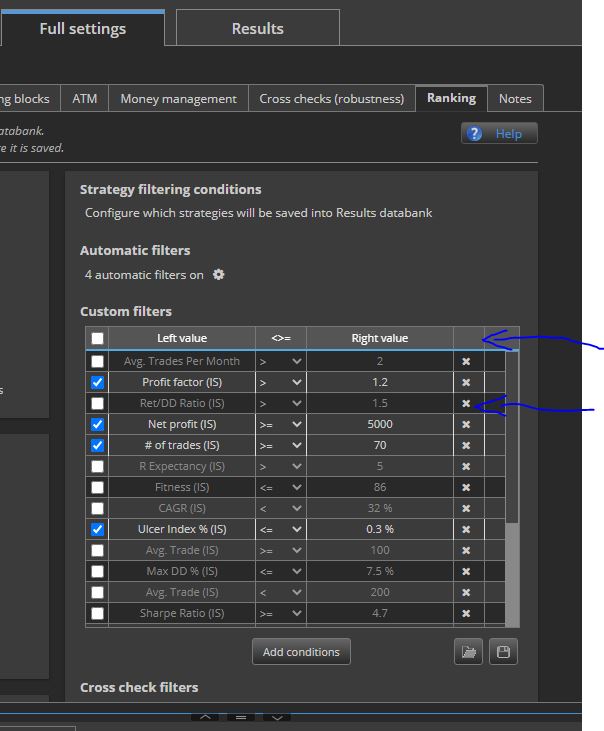
1/ This is why I ask to have the Equity Chart with as Standard deviation on it and a number of standard deviation and length as an option. (Like a Bollinger on Equity Charts)
2/ Actually we have the Drawdown on the charts, we need to have a view of the Profit Factor, Sharp Ratio, Ulcer Index %, Stability, Av Trade over time on the Charts with a Bollinger on it, to be able to see the Statistic variation over time.
It will allow us to see when a strategy is efficient or not, and to filter it only when it is necessary. A good strategy can fails a time, and be good after. It is too bad to loose it.
3/ We need to add as well a standard variation on the filter where the Strategy can be a/filter out of Databank, b/ become inactive but not filter out.
It is not always good to remove completely a strategy from databank. A Strategy can be good as long as its results stay within its Standard Deviation.
4/ Therefore, I ask that we add the option to Activate/inactivate a strategy when its results are in or out of it Standard deviation of this filter
I notice that traders think often that statistic are static, however In my 24 years of research of development, I became aware of the variability of statistic on one strategy. Statistic of a strategy are constantly moving. It is important to select the right strategy and to use it at the right time. We can do it with this filter.
This is why it is important to show them (PF, %, Sharp R, etc.) on the chart and to use it in the filter.


-
Votes +2
-
Project StrategyQuant X
-
Type Feature
-
Status New
-
Priority Normal
History
© Copyright. All rights reserved. ProjectPanel.com
