Inconsistency in WFM stability calculation
In WFM is special metrics called WFM stability. Which should be counted as ratio OOS/IS in given WFM periods. As OOS is usually much shorter than IS there is normalization on 1 day.
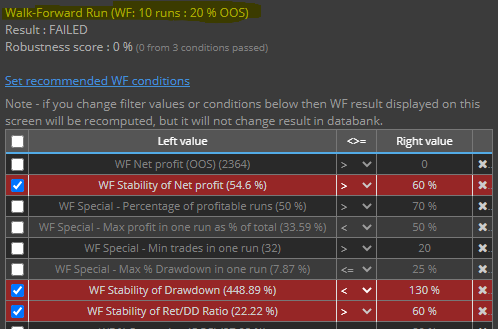
E.g. Stability of Net Profit is counted as (Sum NP(OOSs)/Sum days(OOSs)) / (Sum NP(ISs)/Sum days(ISs)), so we're comparing avg. daily profit in OOS against avg. daily profit in IS. Same formula of calculation is used for e.g. WFM Stability of Drawdown - OK. In XLS marked as green. But for WFM Stability of R/DD is used different formula. It looks like it's just compare= Sum RDD(OOS) / Sum RDD(IS). In XLS marked as blue. So without normalization on 1 day. So different than in NP, or DD. Why?
Not sure if we have to verify all of dozens metrics, or there is some hidden (or published) pattern which metrics is counted which way, or it is just a bug.
In attached files you can find a .sqx of strategy (it is used one of default strategies from retester) with WFM. Then there is a screenshot from chosen WFM cluster, where is shown values of WFM Stabilities of NP, DD, R/DD, and attached excel, exported from SQ, with verify calculations. WFM cluster is chosen on 10 runs, 20 % OOS - what is marked by SQ as recommended combination.
Which brings me to another question: What are the criteria for recommended combination by SQ? If all clusters are 100 % OK there is every time chosen second row in second column.

-
Votes +2
-
Project StrategyQuant X
-
Type Bug
-
Status Fixed
-
Priority Normal
History
Votes: +2
© Copyright. All rights reserved. ProjectPanel.com

Feel free to join some SQX users like you and I on discord: https://discord.com/channels/426766614734831616/426766614734831618