Wrong? calculation of avg. Profit / #Trades per month, or per Year
Columns avg. trades per Year or per Month are calculated by quite confusingly way. Pls. see the attached screen, especially column Total Data Days in relative to the other columns.
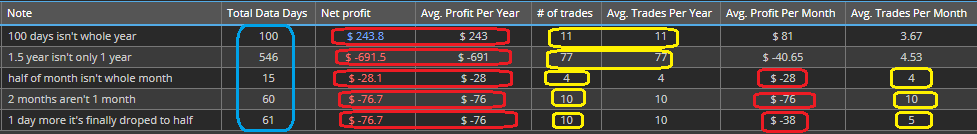
1. Row: If we retest .STR on exactly 100 days (where is the issue easy visible), we have $243 profit, and column Avg. Profit per year indicates as well $243. Which is IMHO wrong, as 100 days is only half of the April. Same situation is with Avg. Trades Per Year.
2. Row: Here we have 1.5 of year = 18 months = 546 days = exactly 1.1.2020 - 31.6.2021. So clearly not just 1 year, but avg. Profit or #Trades per Year indicate stats like it's just 1 Year.
Similar situation is with Avg. #Trades or Net Profit per Month. It counts only complete months.
3. Row: We have here 15 days = half of the month, but stats are here like for whole month.
4. Row: Here we have range 1.1.2019 - 3.2.2019 = 60 Data Days = obviously 2+ whole months (beginning January - March), but stats here are like for only one month.
5. Row: 31 Data Days - finally, we're breached some magical barrier and with 31 Data Days we're starting act like we have exactly 2 months - which will hold until 92 Trading Days.
It looks like there is used some rounding function where Years and Months are counted as whole number until some magical constant is breached.
Which cause everything from 1 - 729 Data Days is divided by 1. Since 730 Trading Days divided by 2 until I guess 3x 365 Trading Days.
I think It would be more logically and intuitive if we use some (Trading Days)/365 normalization than this non linear rounding.

-
Votes +15
-
Project StrategyQuant X
-
Type Bug
-
Status New
-
Priority Normal
History
JT
b
JT
E
b
bentra
05.02.2022 17:18
This is totally true. This is a weird calculation. I see R Expectancy Score uses avgTradesPerMonth within its own calculation too and now I wonder how many other column stats are utilizing a flawed avgTradesPerX.
Nice find TiNTa.
Nice find TiNTa.
v
HH
b
bentra
07.05.2022 22:43totalYearsOfTrading is an int. Fractions should be allowed to make these stats accurate.
int totalYearsOfTrading = stats.getInt("TotalDataYears");
CG
DS
KB
Cc
KB
KB
Kevin
24.05.2022 13:41
I've found the same problem with the way in which Annual % Return is calculated.
It is misleading because it also uses:
int totalYearsOfTrading = stats.getInt("TotalDataYears");
So you get the same Annual % Return for the same return on, say 2 years as, say 2.4 years.
Fs
VH
TT
b
VH
anttropus
06.12.2022 16:23Please, repaire databank column TotalDataDays for forst time as soon as possible. It is essential.
TT
b
binhsir
19.03.2023 13:51
It is considered that the time range of the full sample data and IS , OOS, Potfolio are arbitrary. It is better to compute TotalDataYears and TotalDataMonths according to TotalDataDays. TotalDataYears and TotalDataMonth after conversion should be double type. inculding full sample, IS, OOS, Portfolio. Then CAGR, Annual % return will be calculated more accurately, no matter what range of sample data we choose. Hopefully this will be fixed soon.
l
b
binhsir
25.06.2023 01:45Please fix this bug as soon as possible, This is very meaningful for the standardized measurement and comparison of all statistical metric. It includes all annual, monthly and daily metric
TT
Votes: +15
© Copyright. All rights reserved. ProjectPanel.com
