Cannot create scatter chart
from discord - user tried to create scatter chart in Trading analysis, and it doesn't display any values.
When I post exactly the sam edata to example here: https://codepen.io/DanEnglishby/pen/dqyyzp
it shows the chart.
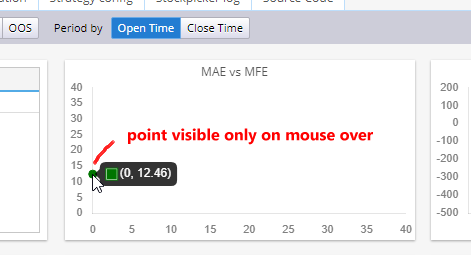
In SQ the chart is empty, but the values are there - they are visible on mouse over - see screenshot.
Maybe outdated chartjs library?
-
Votes +2
-
Project StrategyQuant X
-
Type Bug
-
Status Fixed
-
Priority Normal
History
MF
MF
Mark Fric
07.07.2022 14:49
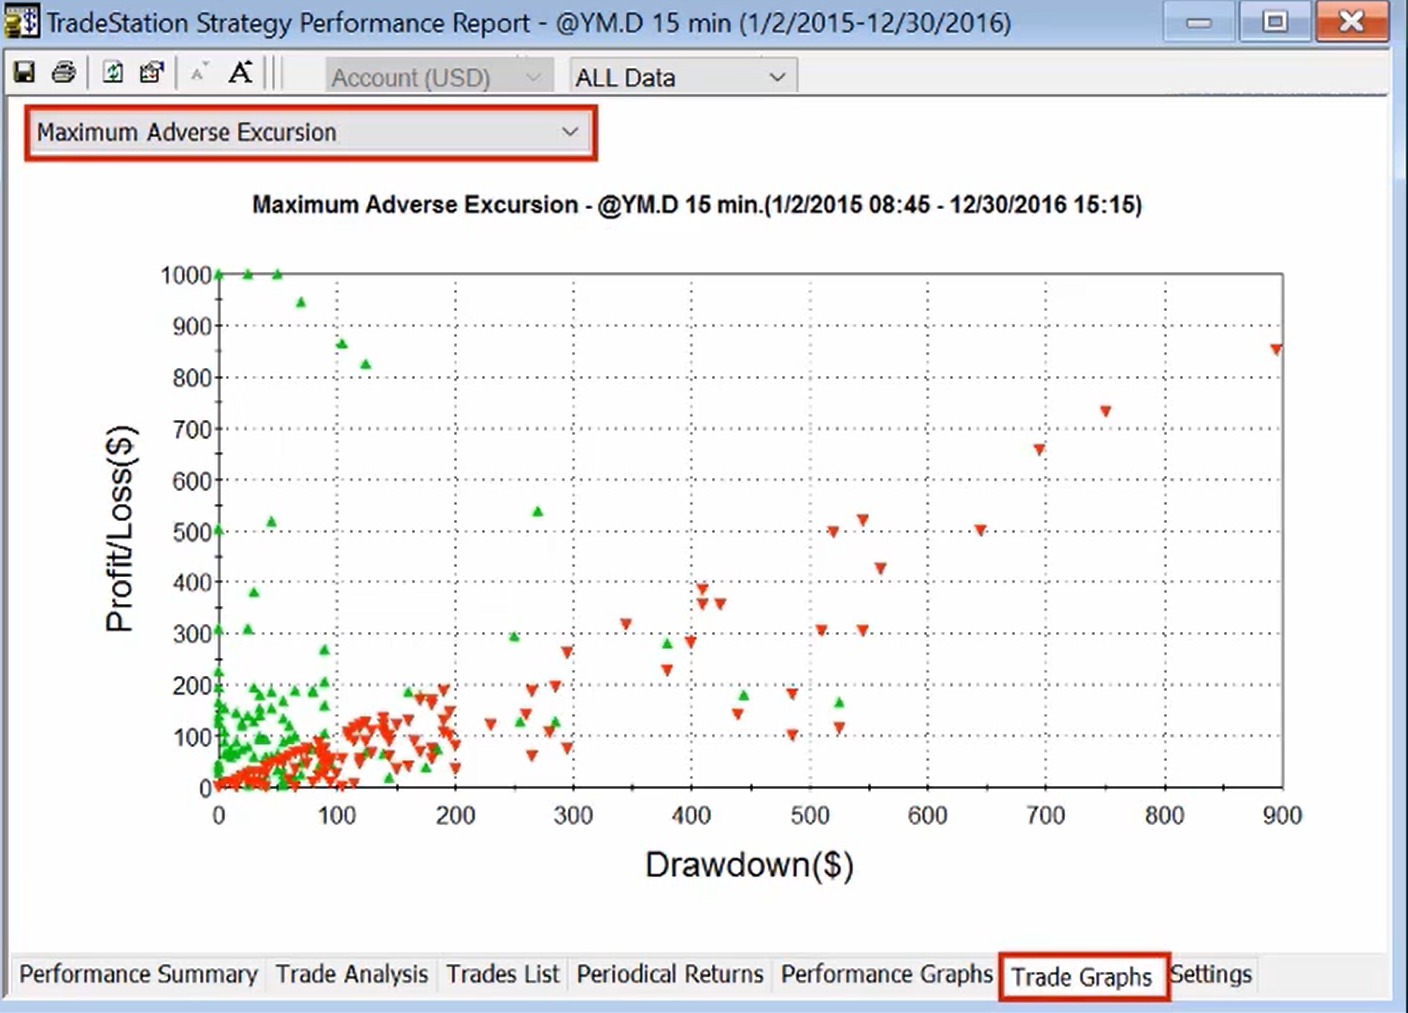
ths is how the chart should look like:
Bt
beetrader
07.07.2022 15:45
This is a not a bug.
Once I specify the this.chart.pointRadius = 1; I can see the chart plot.
Maybe you may want to add a default value of 1 to the chart radius.
Bt
E
TT
Votes: +2
© Copyright. All rights reserved. ProjectPanel.com
