Bad distribution of trades in equity charts when showing portfolio
Bad distribution of trades in equity charts when showing portfolio
It's when we select trades.


-
Votes +1
-
Project StrategyQuant X
-
Type Bug
-
Status Refused
-
Priority Normal
History
AA
b
TT
Tamas
20.09.2022 12:31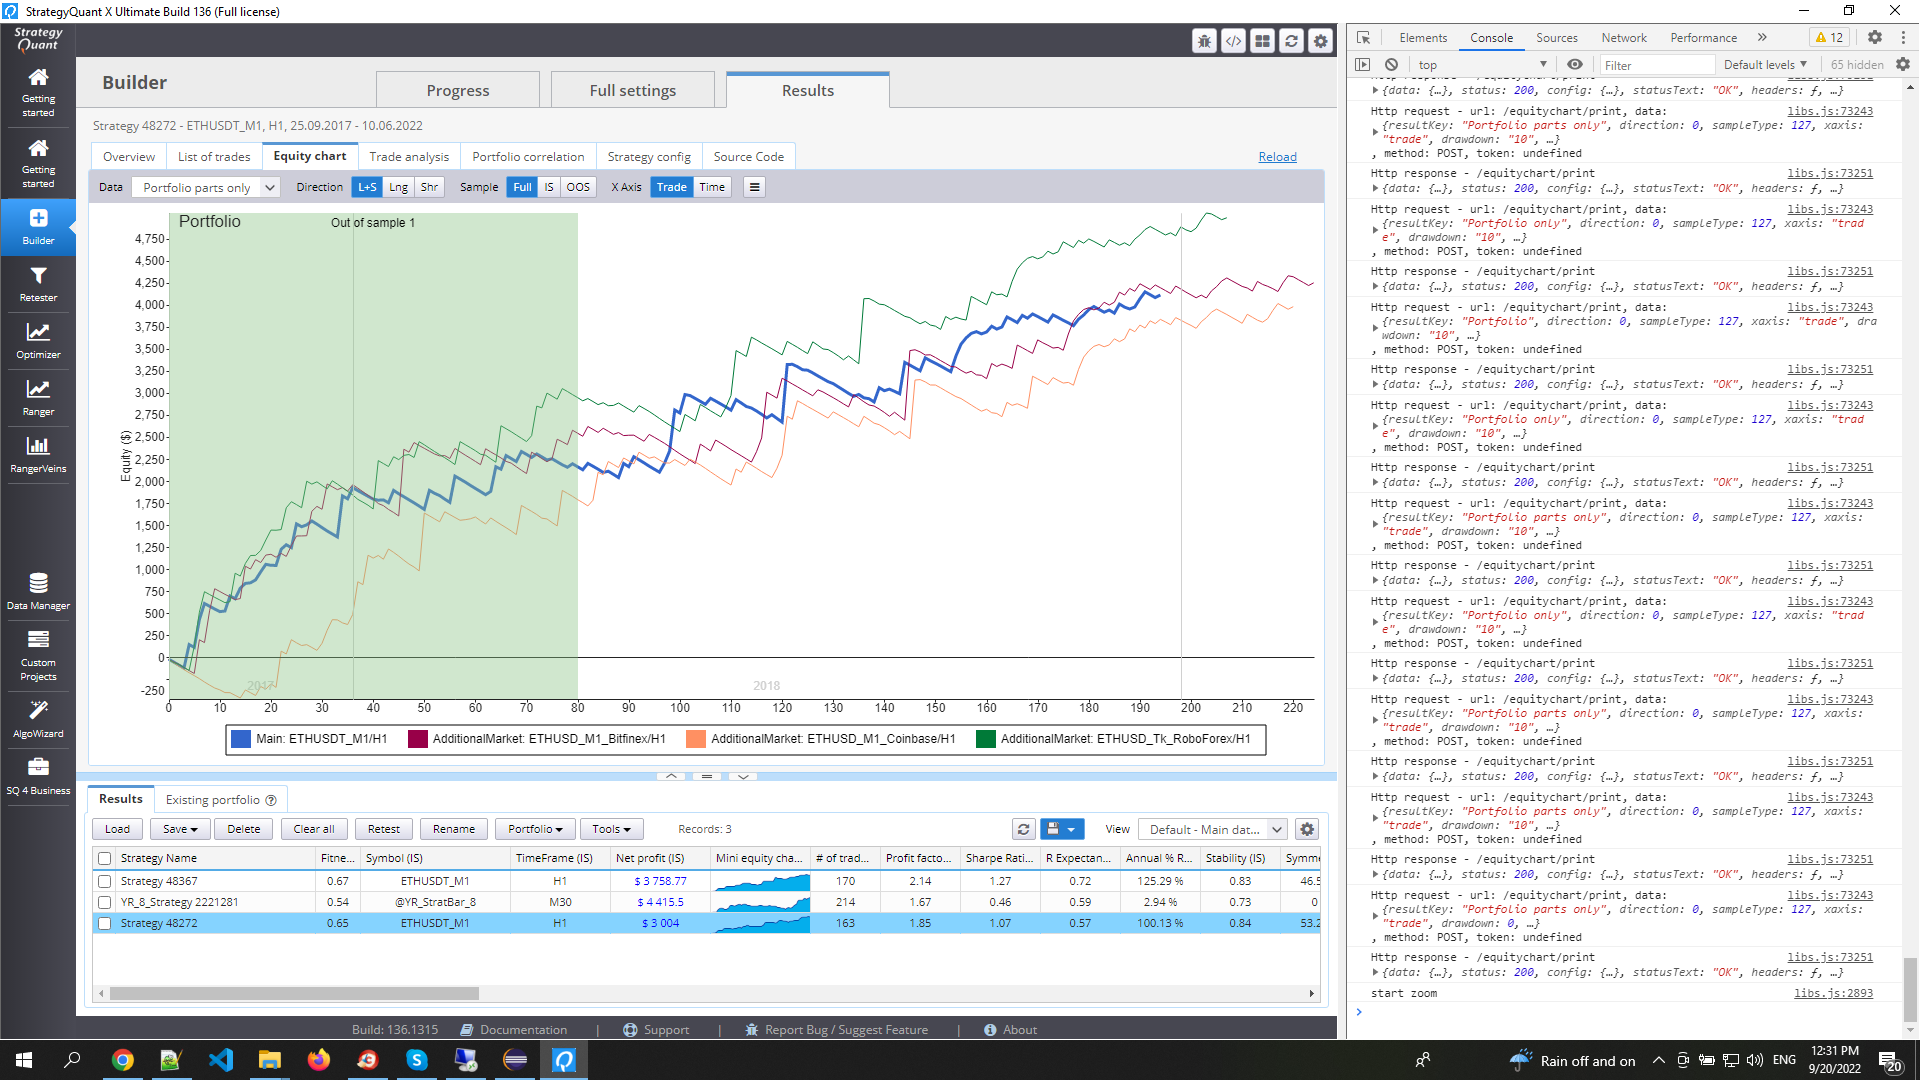
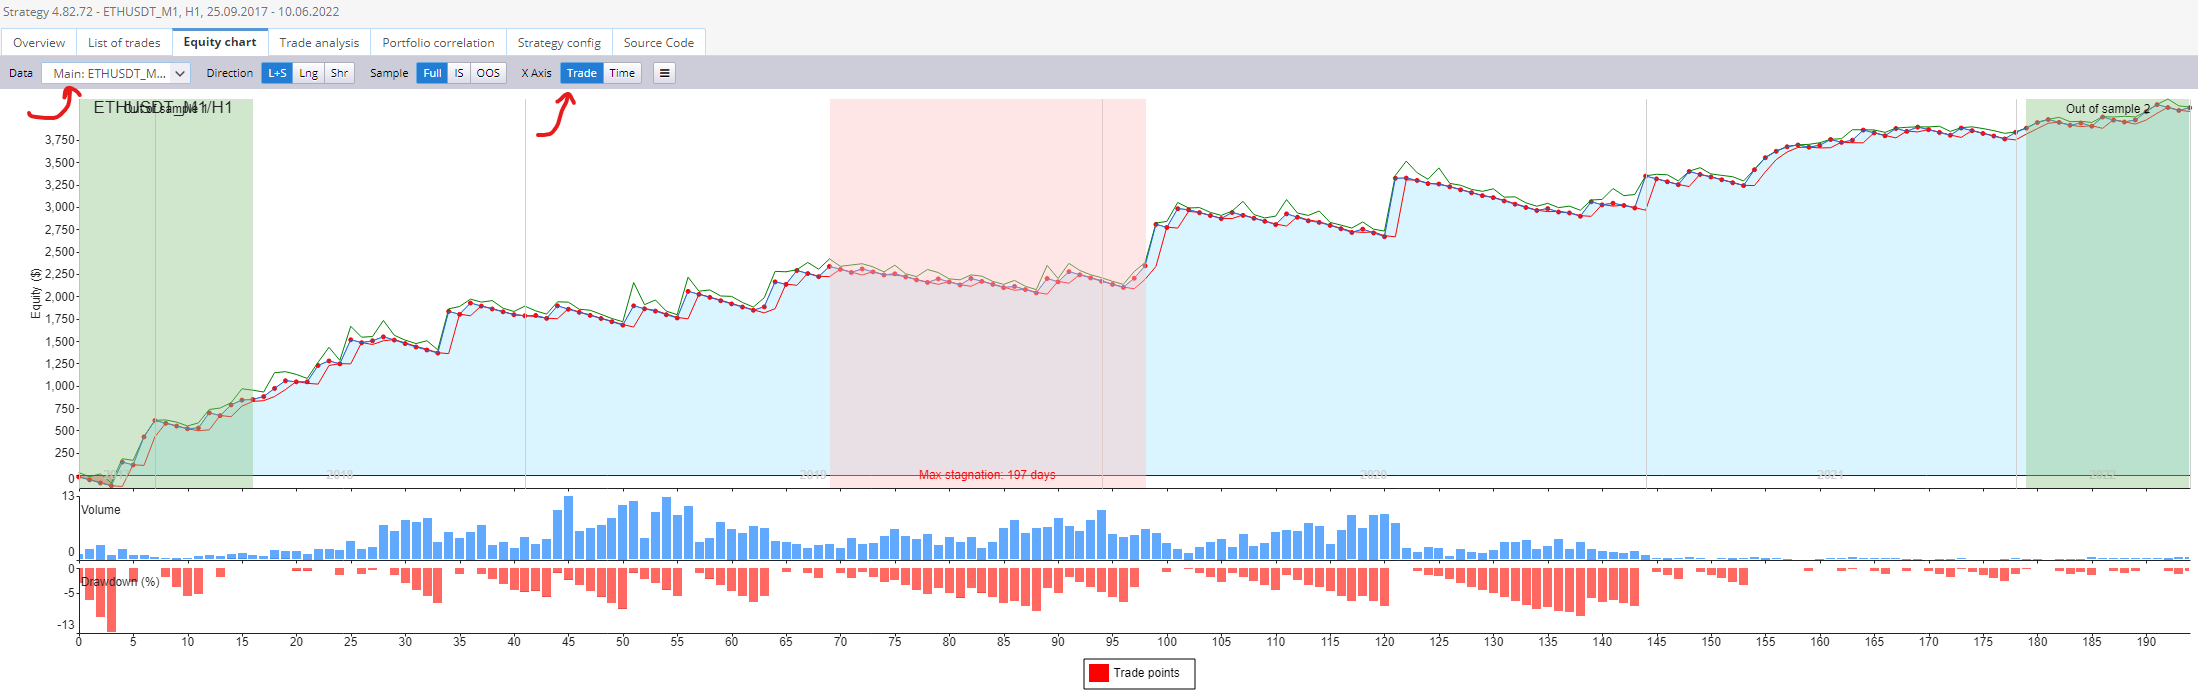
This has 2 solutions. Hide volume/dd chart or switch to Time axis.
AA
Alex
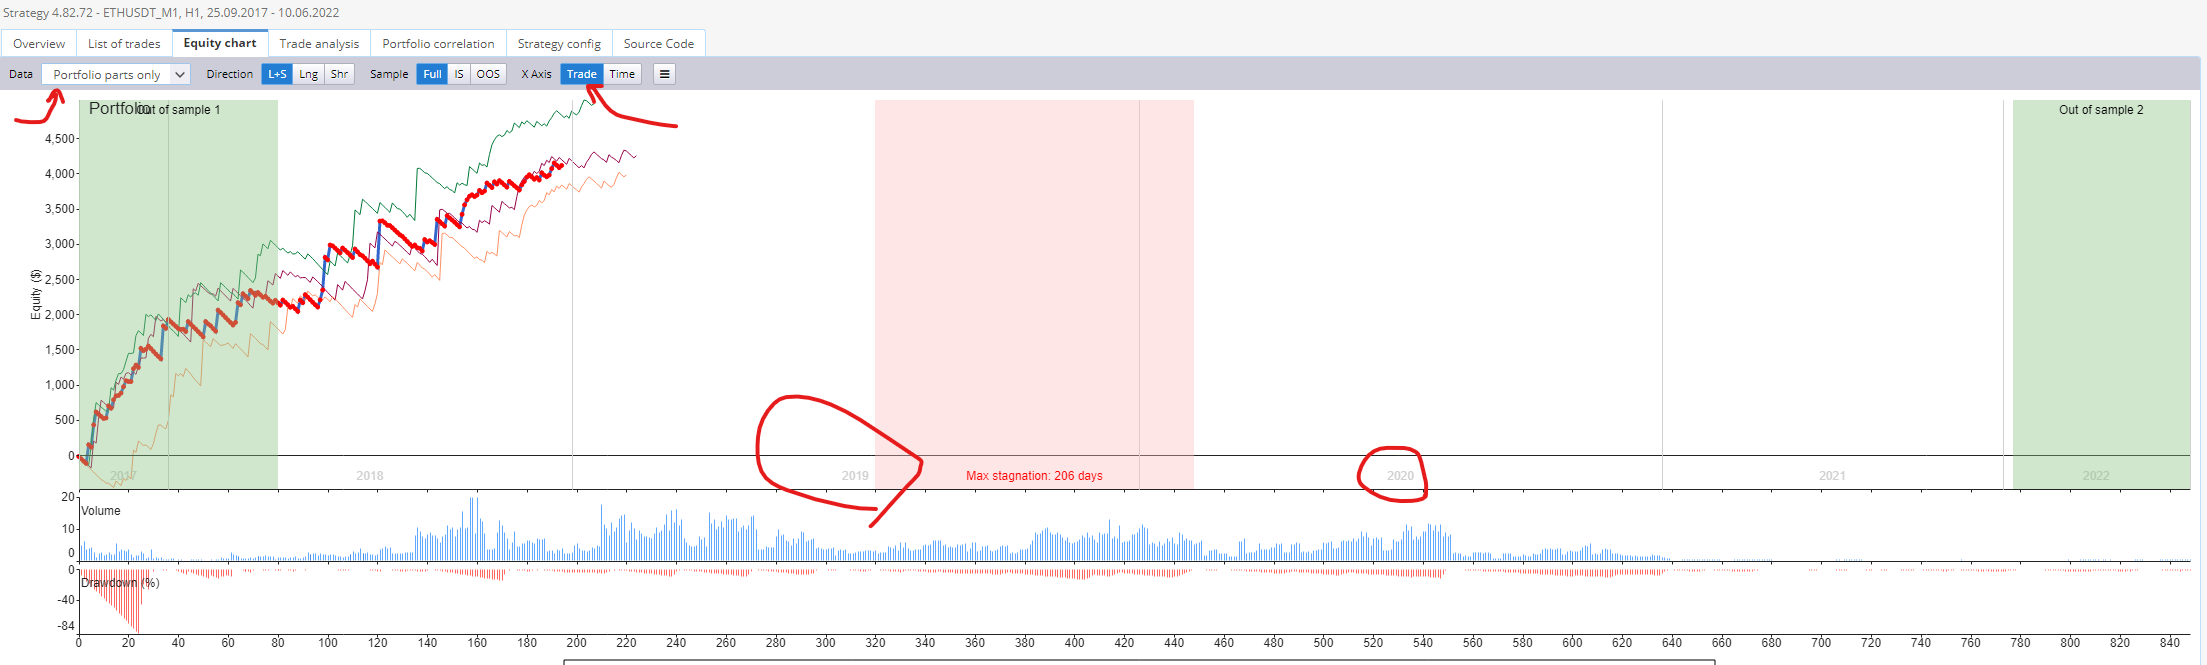
20.09.2022 13:04When we can see trades, drawdown, etc. in trade mode and not time mode (with trades shown in their correct position during years), why we shouldn't be able to see it in portfolio mode?
This is a bug.
Please recheck.
b
bentra
20.09.2022 14:53
Tamas is right, how can volume possibly work for every trade in a portfolio with separate lines for each part? The volume would need a separate graph for each part too. Just turn the volume off like in Tamas's screenshot and it looks good.
AA
Alex
15.10.2022 12:46
Hi SQX Team,
I can not realize why volumes and drawdowns can be distributed correctly in trade mode, but trades can not!
Votes: +1
© Copyright. All rights reserved. ProjectPanel.com
