About the usage of Total data years, Total trading years, Total data Months, Total trading Months
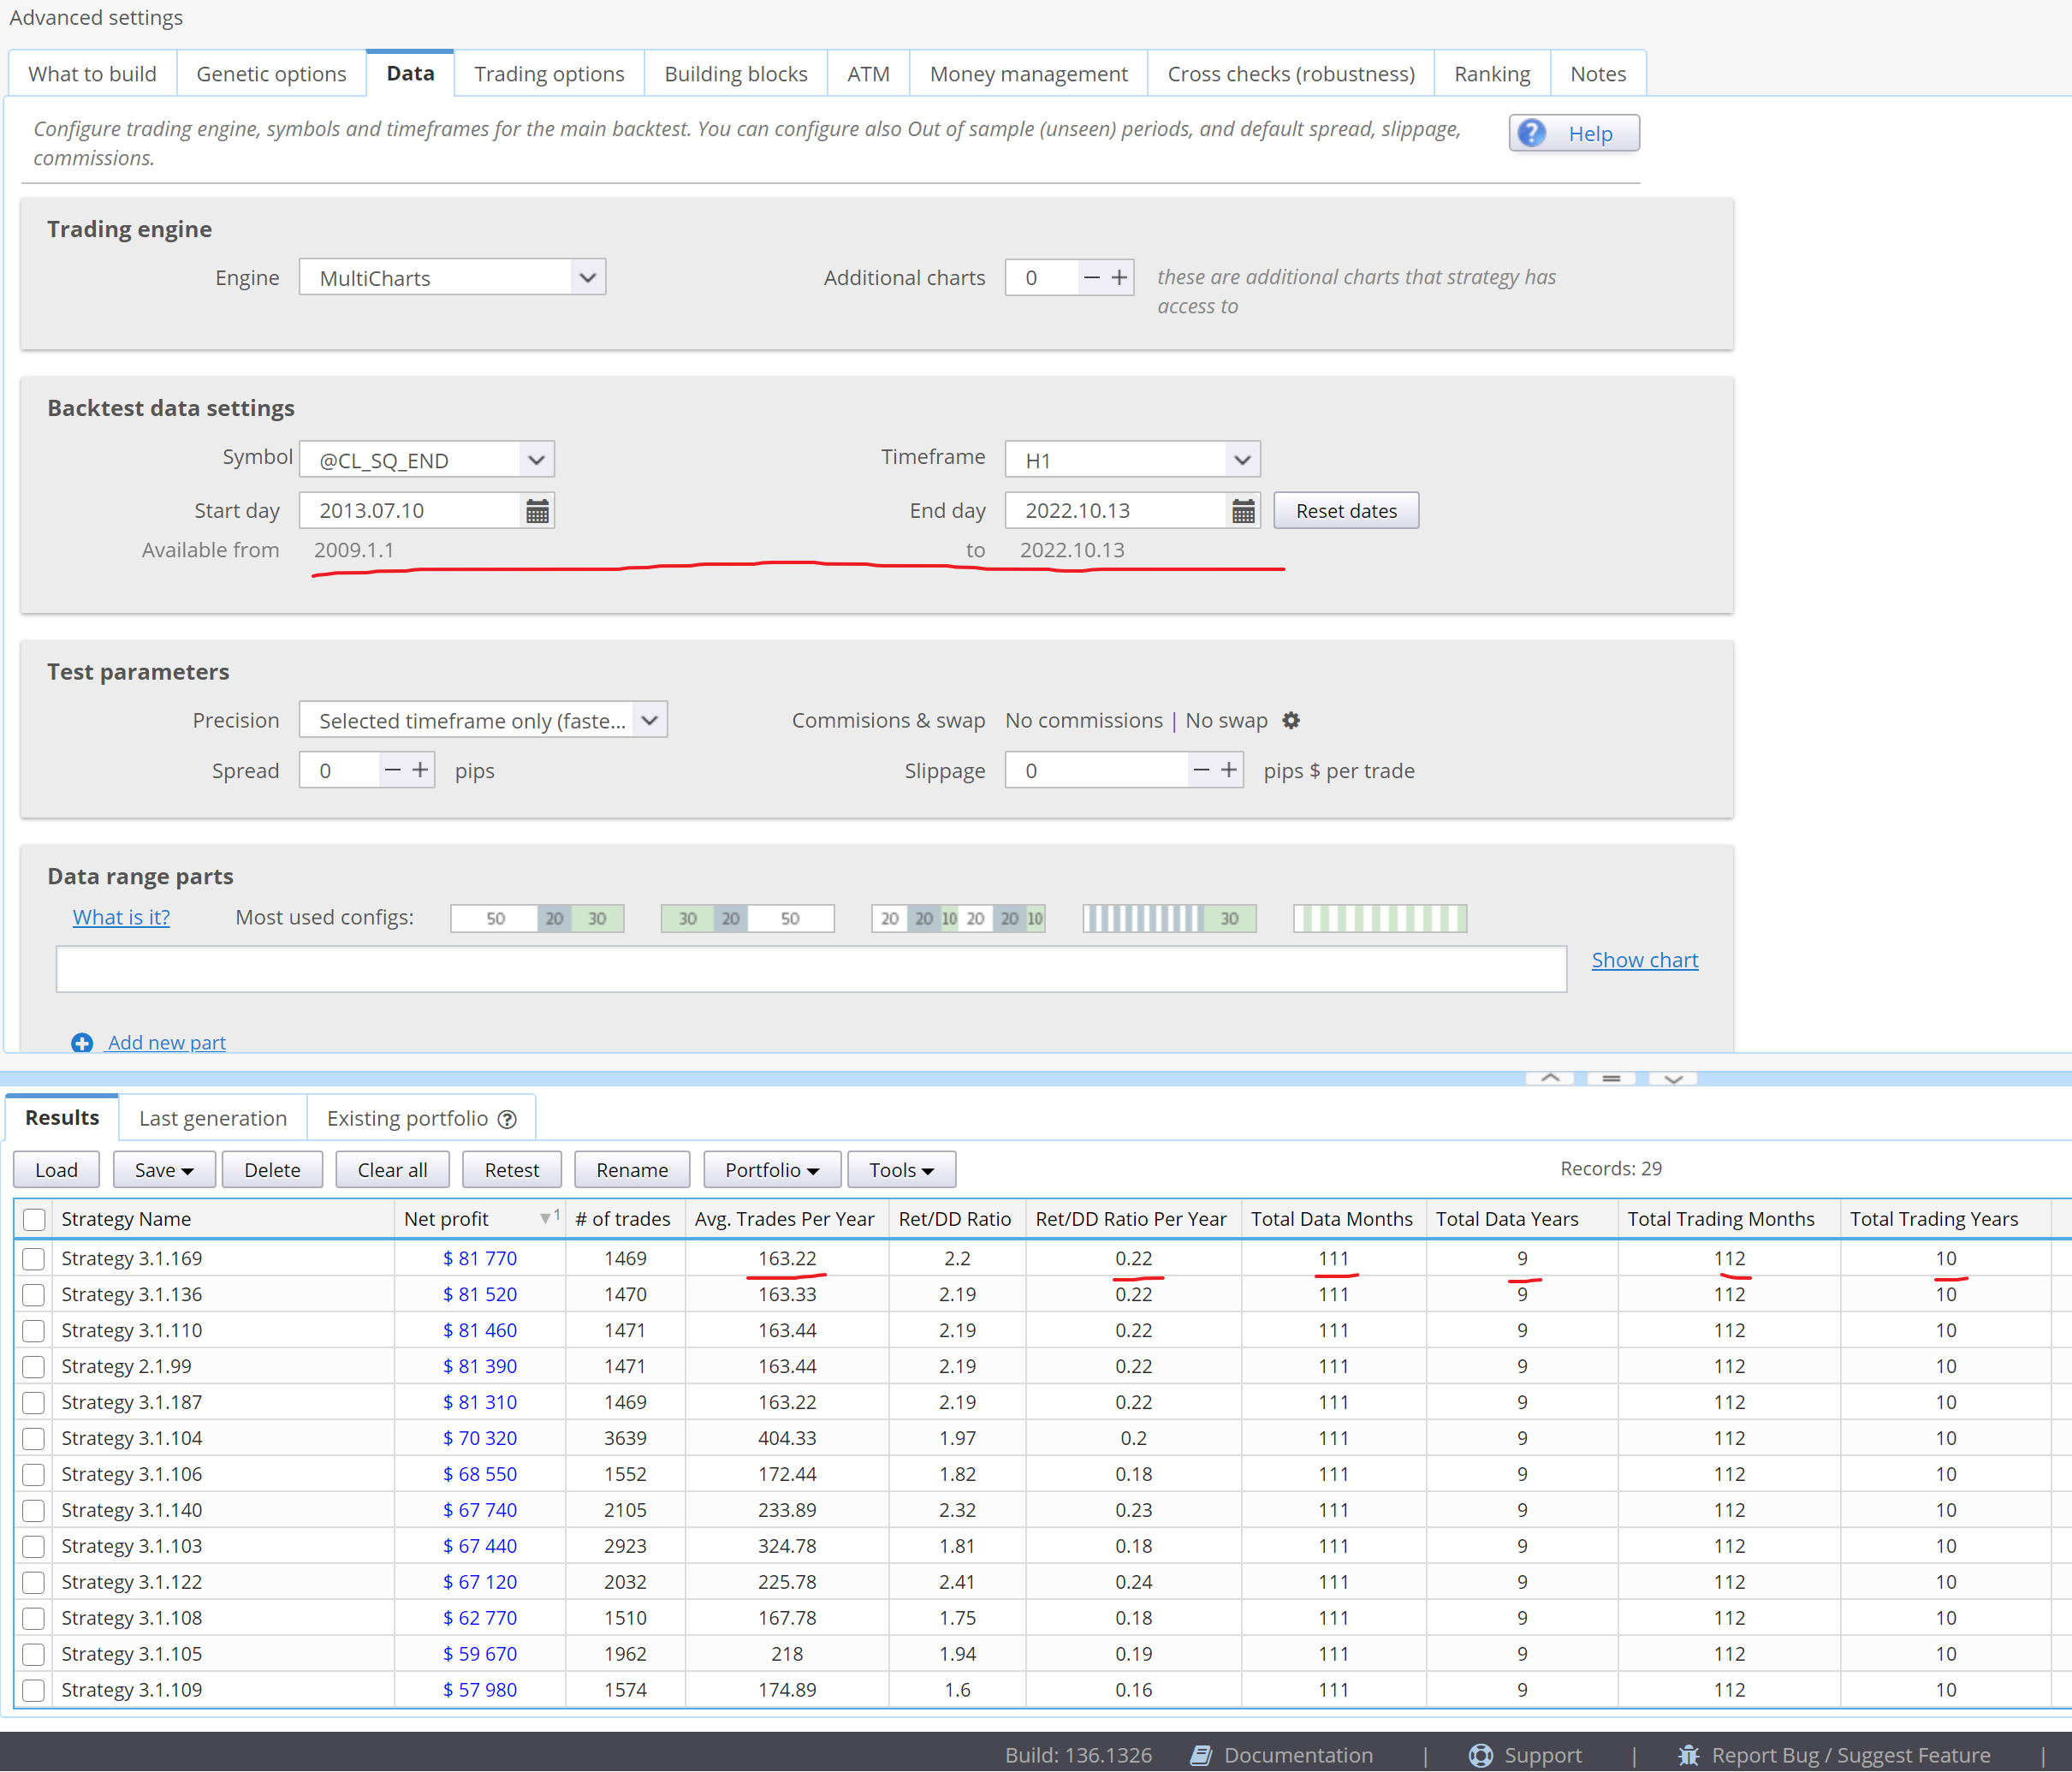
1. According to code, avg. trades per year = # of trads/total data years, Is this calculation appropriate? However, Ret/dd ratio per year(custom metric)=Ret/DD ratio/total trading years.
2. What is the difference between total data and total trading? Does it mean rounding? One is small and the other is big?
3. Because there are always some test cases, the start time of the data is not necessarily January 1 at the beginning of the year, and the end time of the data is not necessarily December 31 at the end of the year. Obviously, the calculation error of monthly metric is very small. But for all standardized annualized performence metric, such as avg. trades per year, ret/dd ratio per year and so on. Considering better universality of the calculation formula.Whether it should be calculated according to the actual days and months of sample data converted into an annual number? In fact, I think it's accurate enough to annualize it on a monthly basis.

-
Votes +3
-
Project StrategyQuant X
-
Type Bug
-
Status Duplicate
-
Priority Normal
-
Assignee Mark Fric
-
Category Backend
History
binhsir
26.11.2022 01:37Description changed:
1. According to code, avg. trades per year = # of trads/total data years, Is this calculation appropriate? However, Ret/dd ratio per year(custom metric)=Ret/DD ratio/total trading years.
2. What is the difference between total data and total trading? Does it mean rounding? One is small and the other is big?
3. Because there are always some test cases, the start time of the data is not necessarily January 1 at the beginning of the year, and the end time of the data is not necessarily December 31 at the end of the year. Obviously, the calculation error of monthly metric is very small. But for all standardized annualized performence metric, such as avg. trades per year, ret/dd ratio per year and so on. Considering better universality of the calculation formula.Whether it should be calculated according to the actual days and months of sample data converted into an annual number? In fact, I think it's accurate enough to annualize it on a monthly basis.
binhsir
17.01.2023 08:06binhsir
17.01.2023 10:26Tamas
10.02.2023 09:04Assignee changed from Mark Fric to Mark Fric
Status changed from New to Duplicate
Category changed from None to Backend
binhsir
19.03.2023 13:53© Copyright. All rights reserved. ProjectPanel.com
