Some troubles about the difference of backtest results between SQ and MC
Probably most sq users use MT4/5 for trading. But i'm Multicharts user, because it is a legal system trading software in both the US market and emerging markets for trading futures and stocks. As we all know, the strategy developed in sq must be finally tested and verified under the trading platform. Unfortunately, The backtest reports of the two platforms are usually more or less different, sometimes very big.Include net profit, total number of trades, and profit distribution per year. It has to take me quite a bit of time to do this, especially when i am building a big portfolio. The differences due to different settings are not within the scope of this discussion. I think there are several reasons:
1.Some strategies trigger a bug in SQ(For example sq4_9829, recently I discovered that SQ generate false source code once using MA indicator).
2. Opening times have been adjusted historically in some emerging markets .For example, the opening time is adjusted from 9:15 to 9:30.This makes a carriage return difference to the M30's strategy.The default cutting bar method in MC is 9:15-9:45,9:45-10:15,and so on.(Of course, this can also be understood as session setting is different.)
3. metric calculation bug, for example Calmar ratio which can be referred to the task https://roadmap.strategyquant.com/tasks/sq4_010020
4.Three computational differences the SQ engine and the MC engine.
a.Comparing the backtest reports of sq and MC, even though Net profit and the total number of trades are exactly the same, we will find different annual profits and monthly profit in period reports. Many strategies that have a long average holding time will show a profit of 0 for many months.The main reason is that MC calculate the Openpositionprofit in each year,month,day for trade. SQ calculate simply according to the entry time or exit time of the trade. Some statistical metric/column related to cyclical profits may gernareate bigger bias in SQX, such as Sharp ratio, Sortino ratio. So you will find that even though the default value of the risk-free return in SQ is 5%, but Sharp ratio in SQ is often much higher than MC's value even risk-free return be set 2%. This way of calculation will lead to a larger error when calculating Portfolio Sharpe/Sortino ratio.
b. Huge portfolio correlation difference bettween SQ and MC, which can be reffered to the task https://roadmap.strategyquant.com/tasks/sq4_9928
c.The logic of slippage calculation is inconsistent between the two platform, which can be referred to the report Error of slippage calculation between Multicharts and SQX - Strategy Quant.
d. Slippage calculation bug when using the money management method, which can be referred to the report https://roadmap.strategyquant.com/tasks/sq4_010008
e.Differences in the calculation of commision. Although error in this reason is the smallest of several factors. For many futures and stocks in emerging markets, commission is usually calculated persentage based by entry amount and exit amont. So SQ should be add percentage based per side option.
f. differences in the treatment of max refernce bars. As you can see in task:
Differences in the treatment of max reference bars between MC and SQ - Strategy Quant
Second bug about max reference bar - Strategy Quant
To sum up, I think it is very necessary to optimize these three known calculation differences in order to greatly save the time of the last step, the comparison and verification of the backtest reports of the two platforms. Once optimized, finding other bugs or problems can be very efficient.
-
Votes +7
-
Project StrategyQuant X
-
Type Bug
-
Status New
-
Priority Normal
History
anonymous
16.01.2023 06:55Attachment monthly performance-rb.jpg added
Attachment monthly performance.jpg added
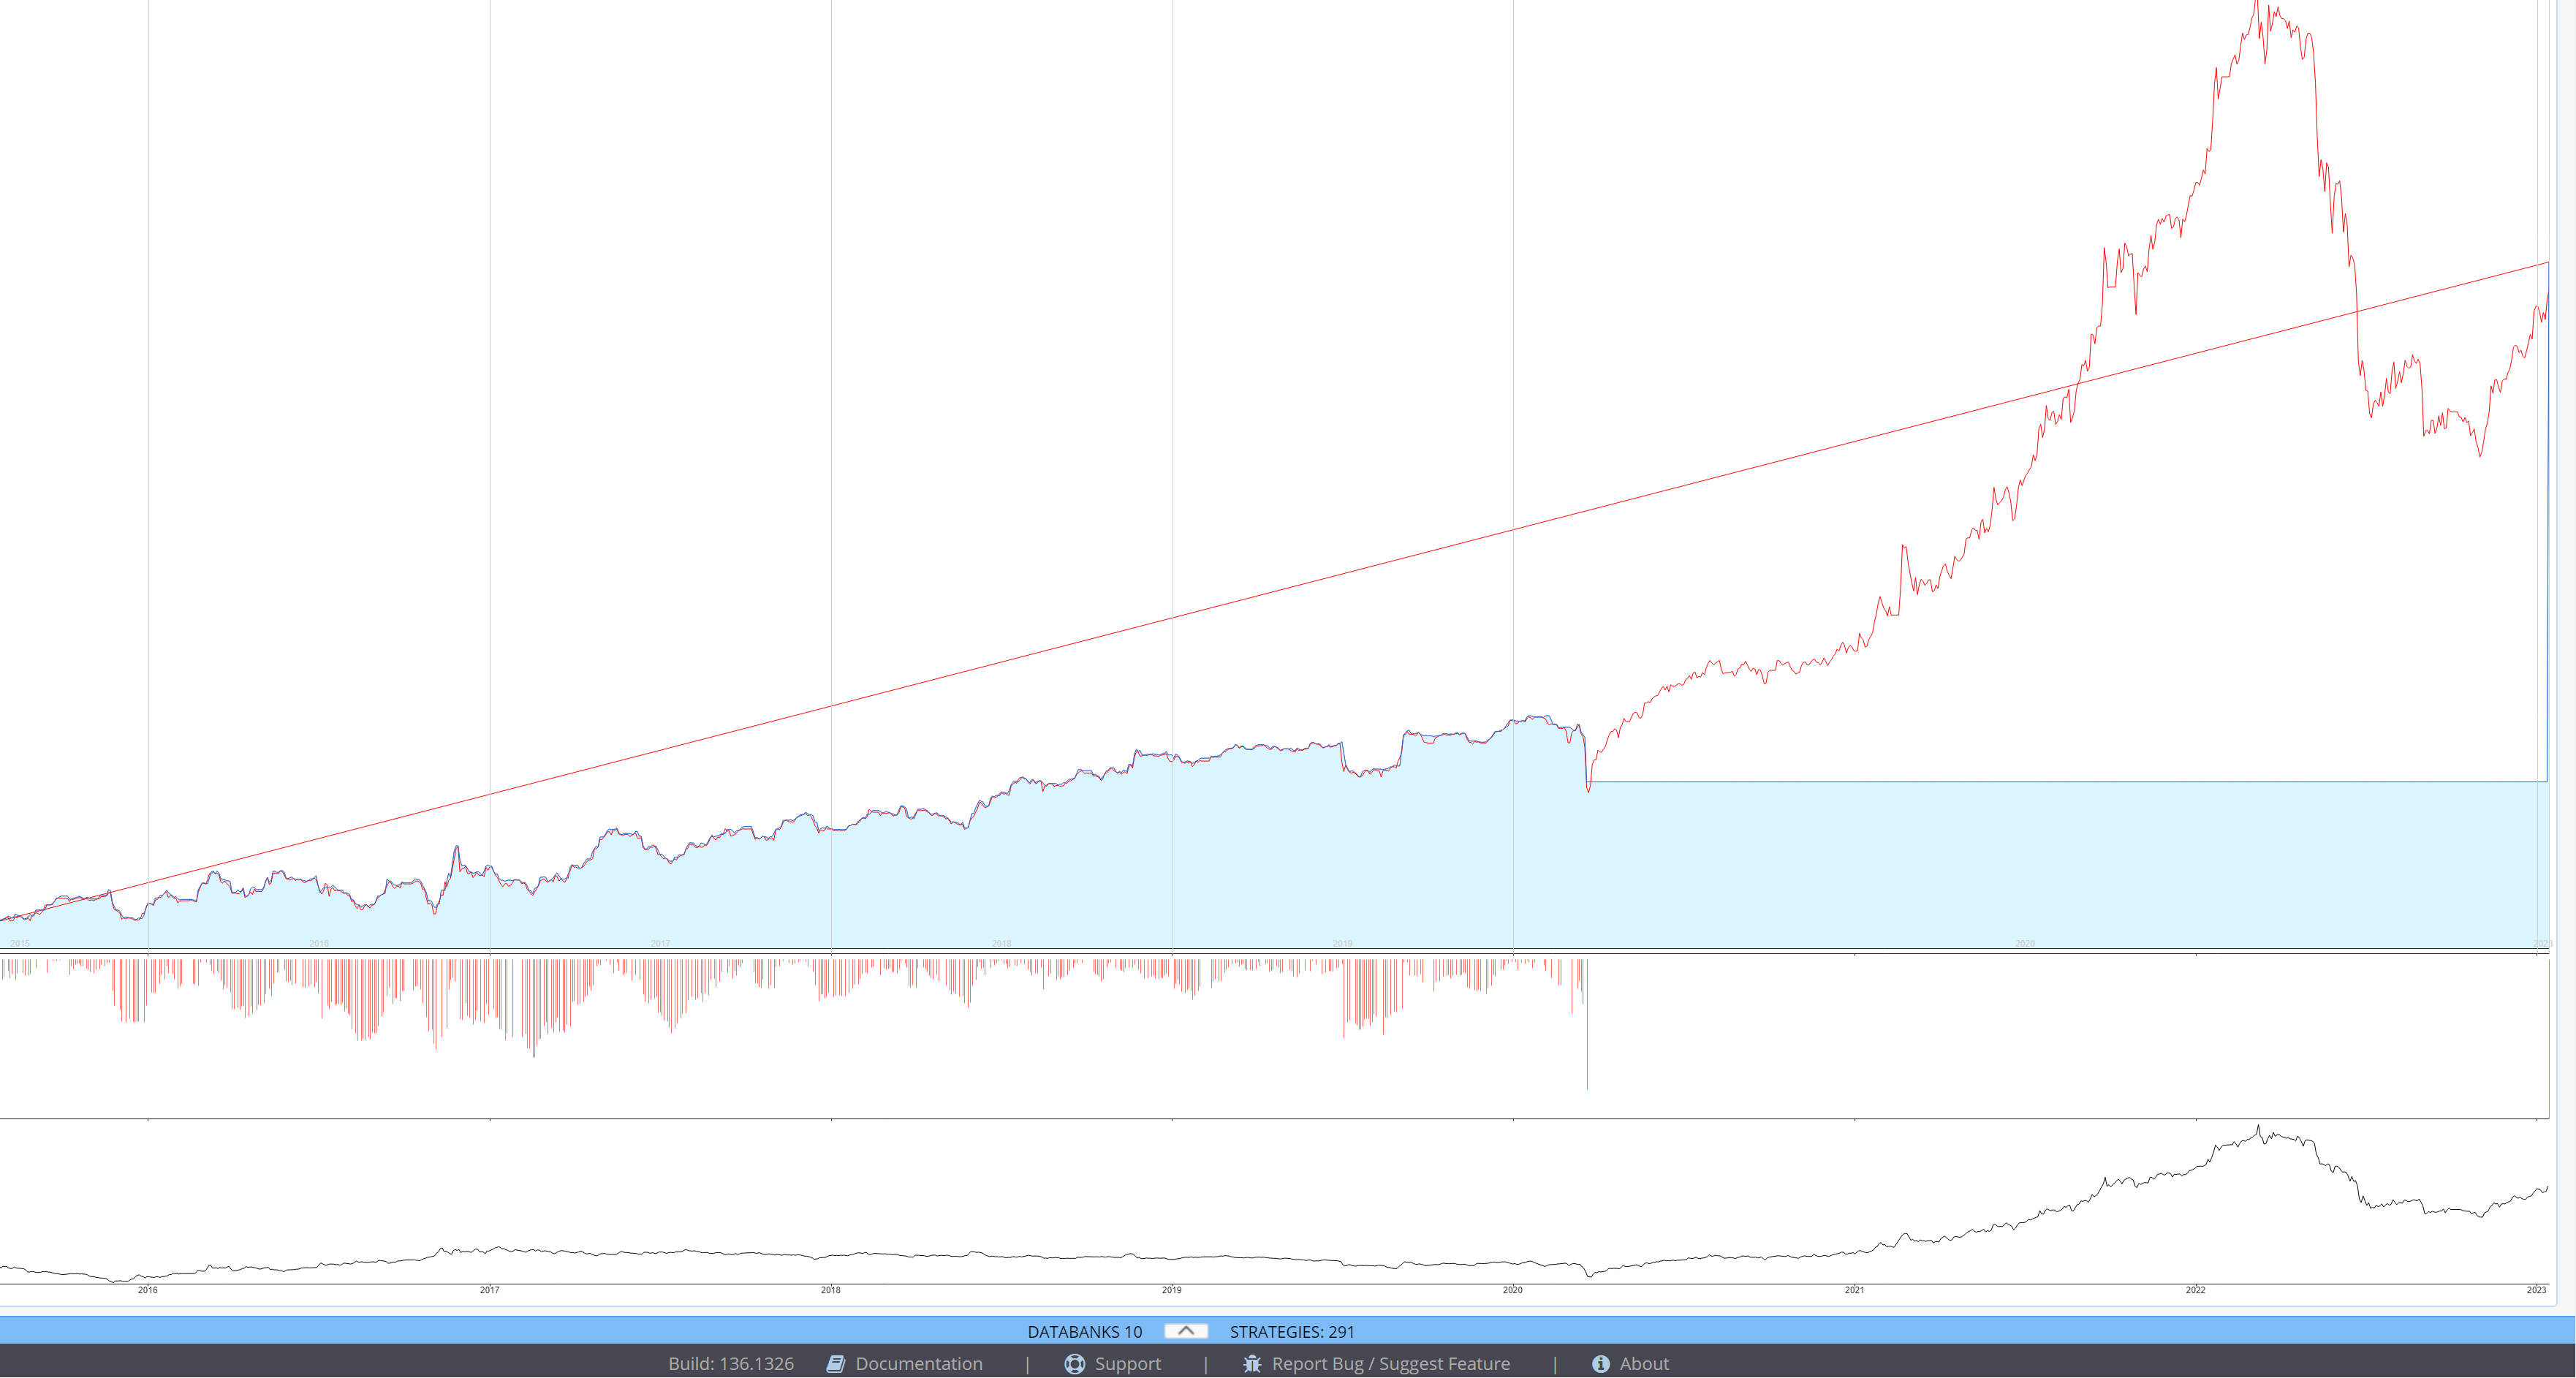
Attachment monthly equity.jpg added
Attachment time option.jpg added


add additional information:
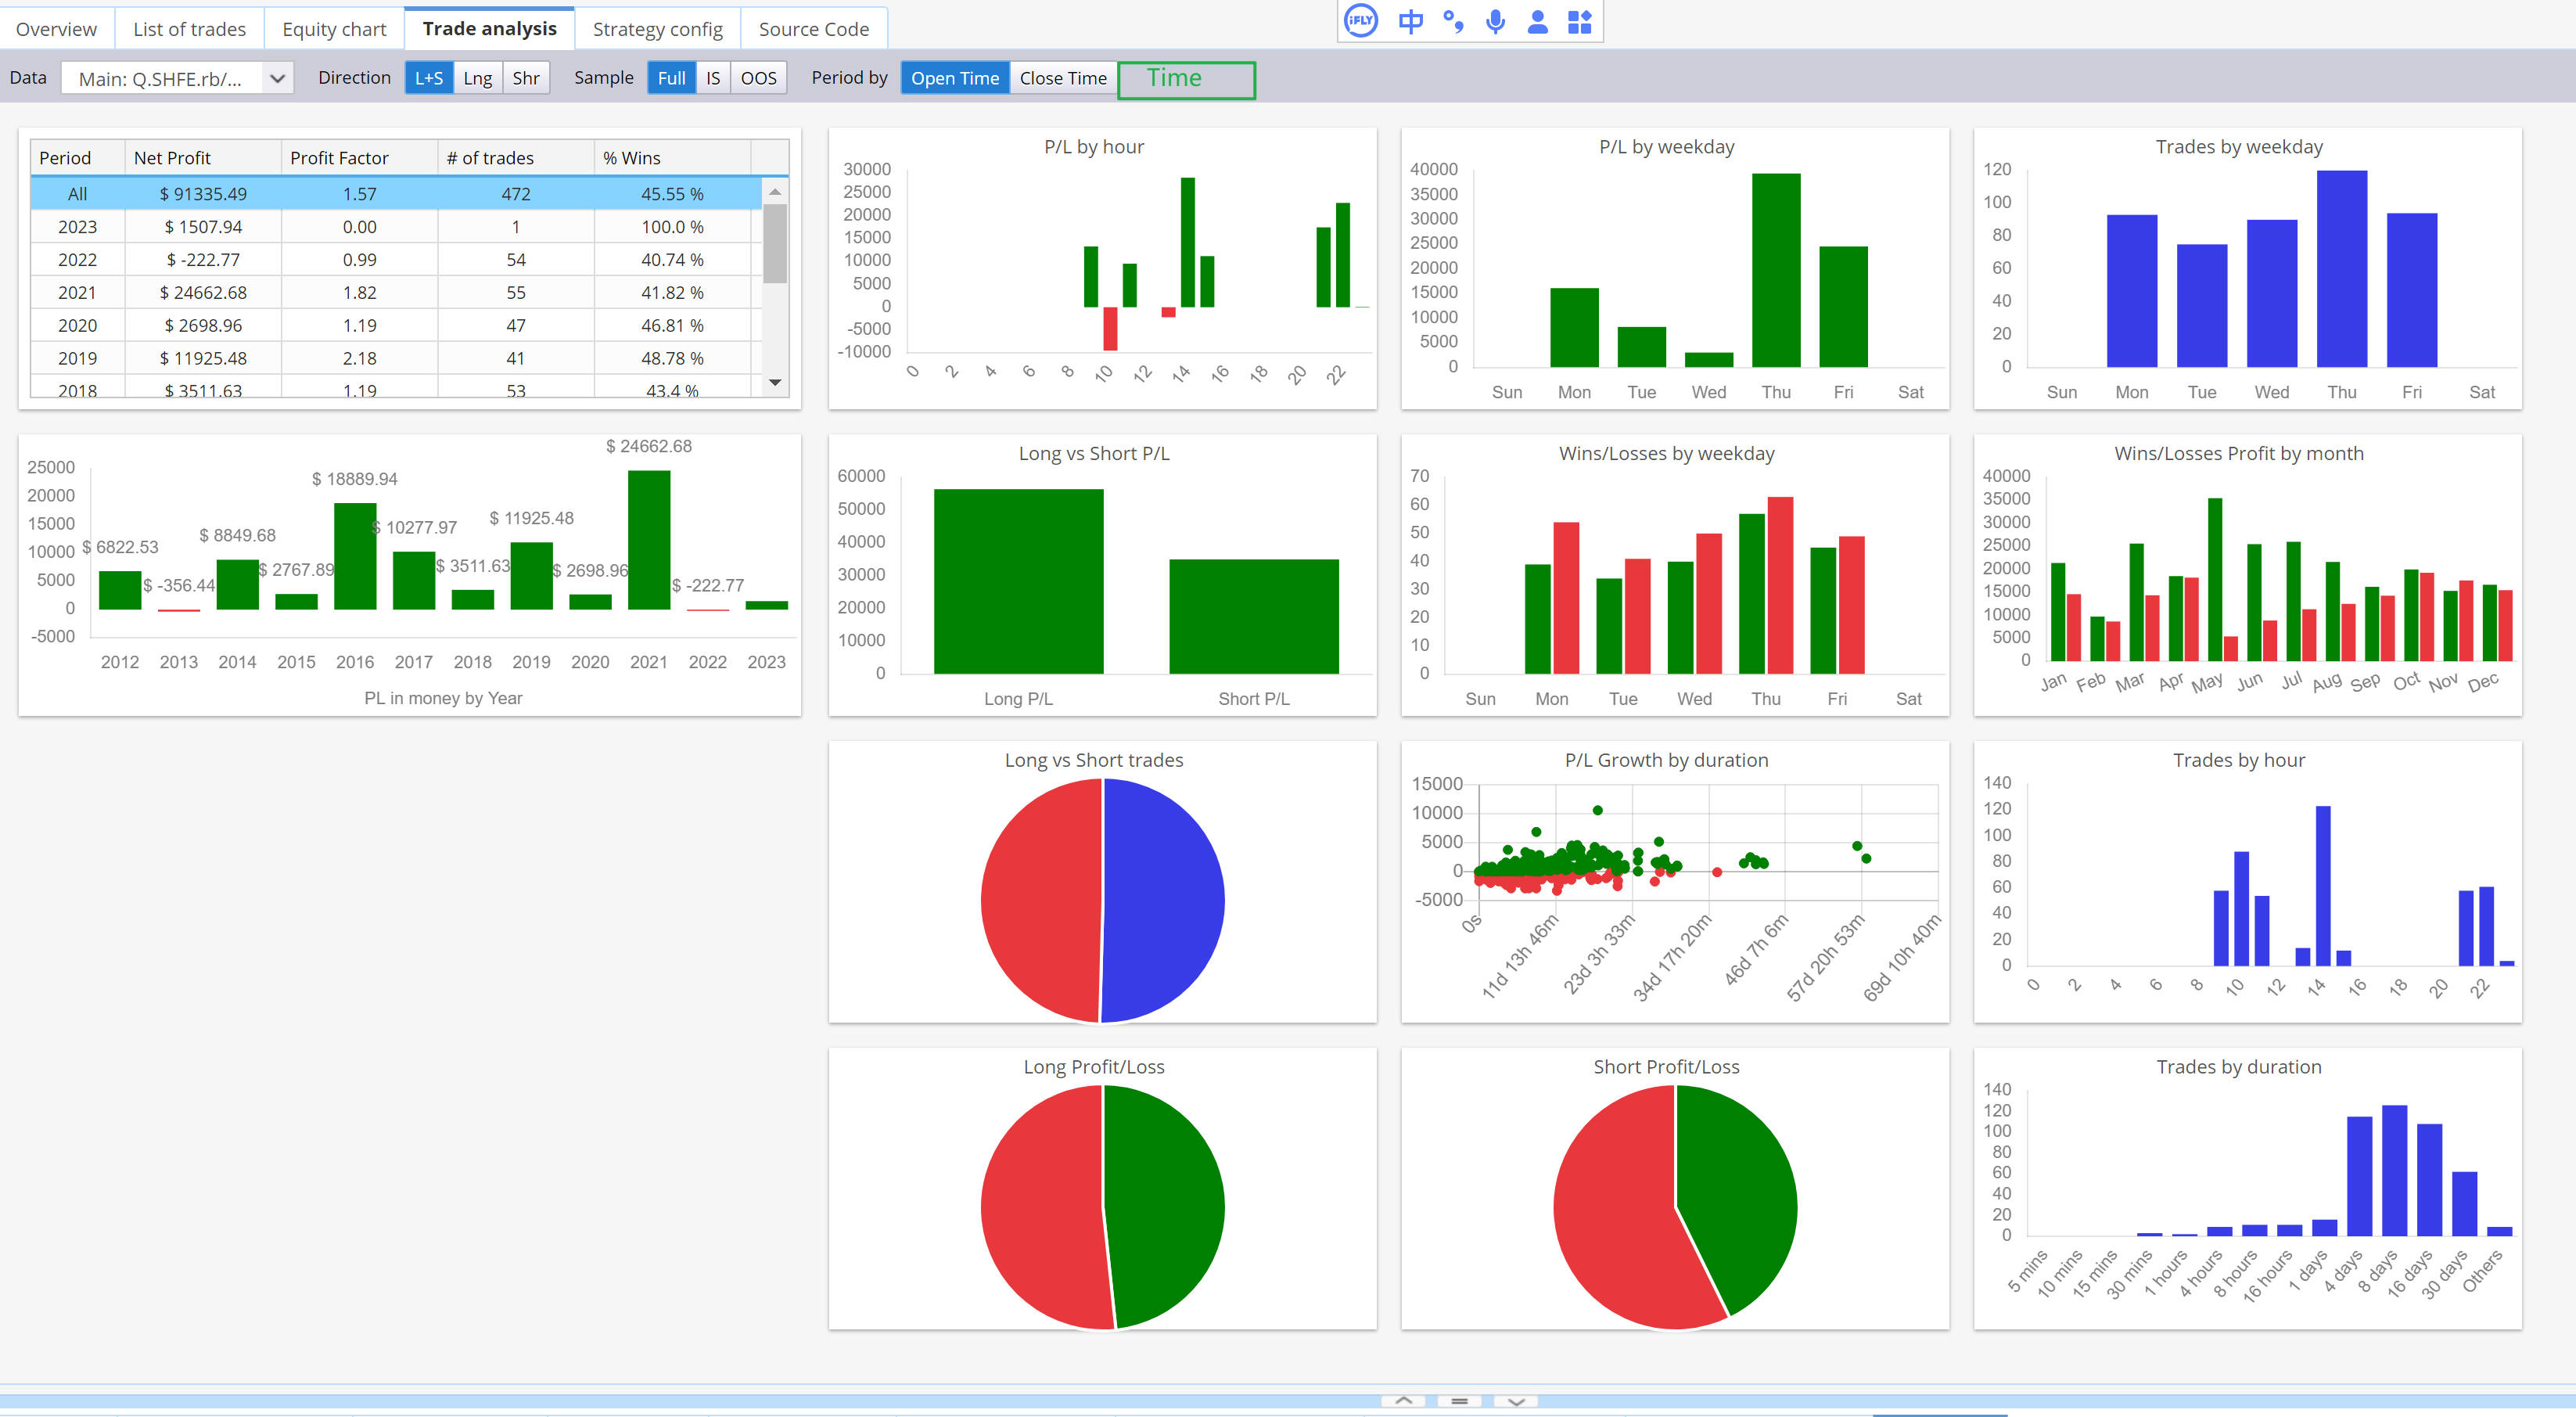
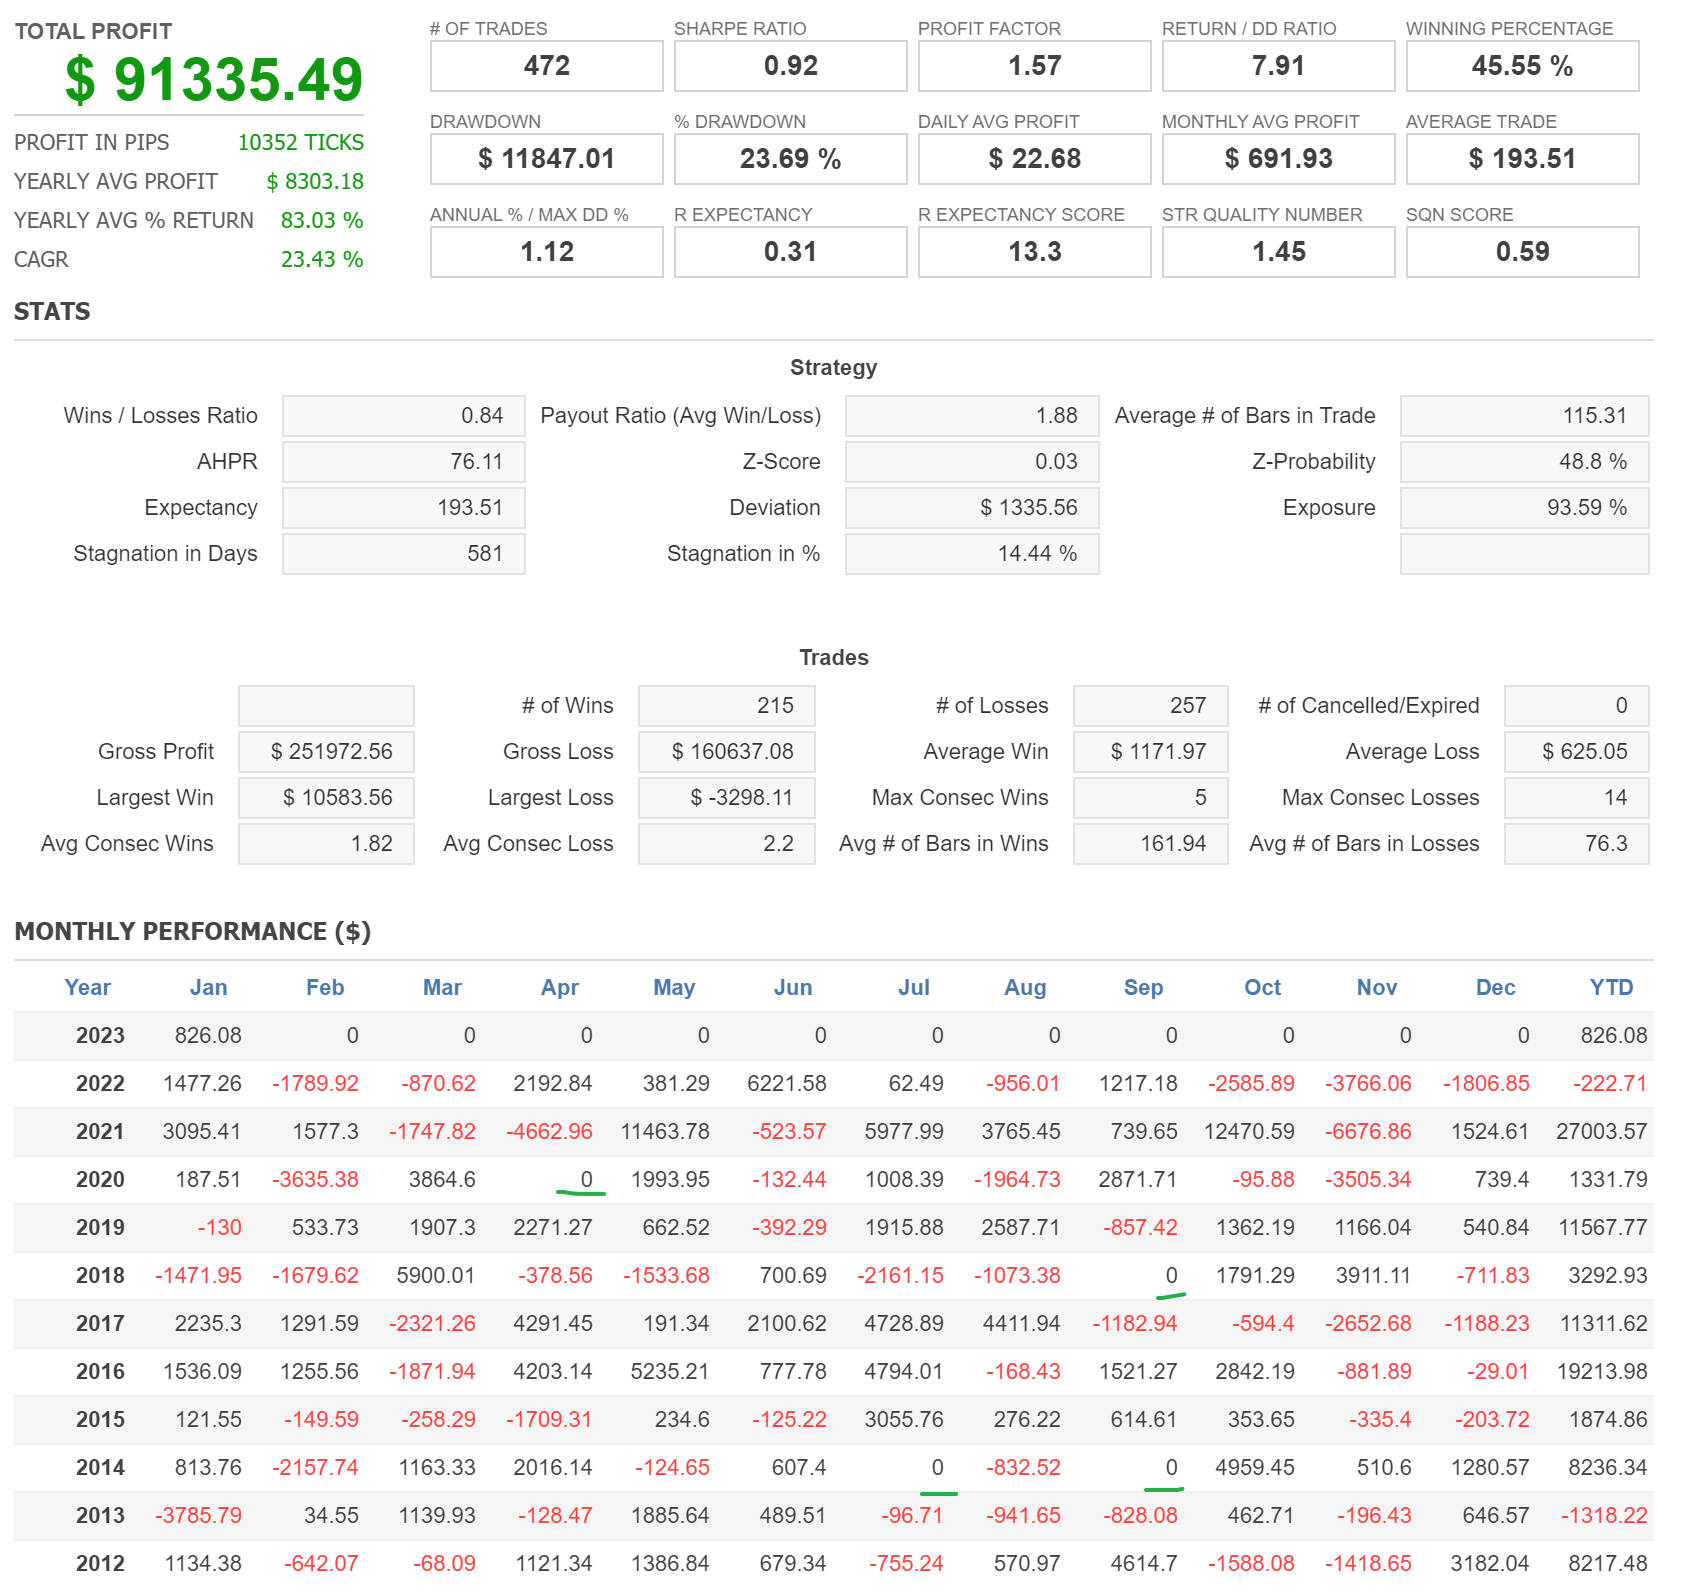
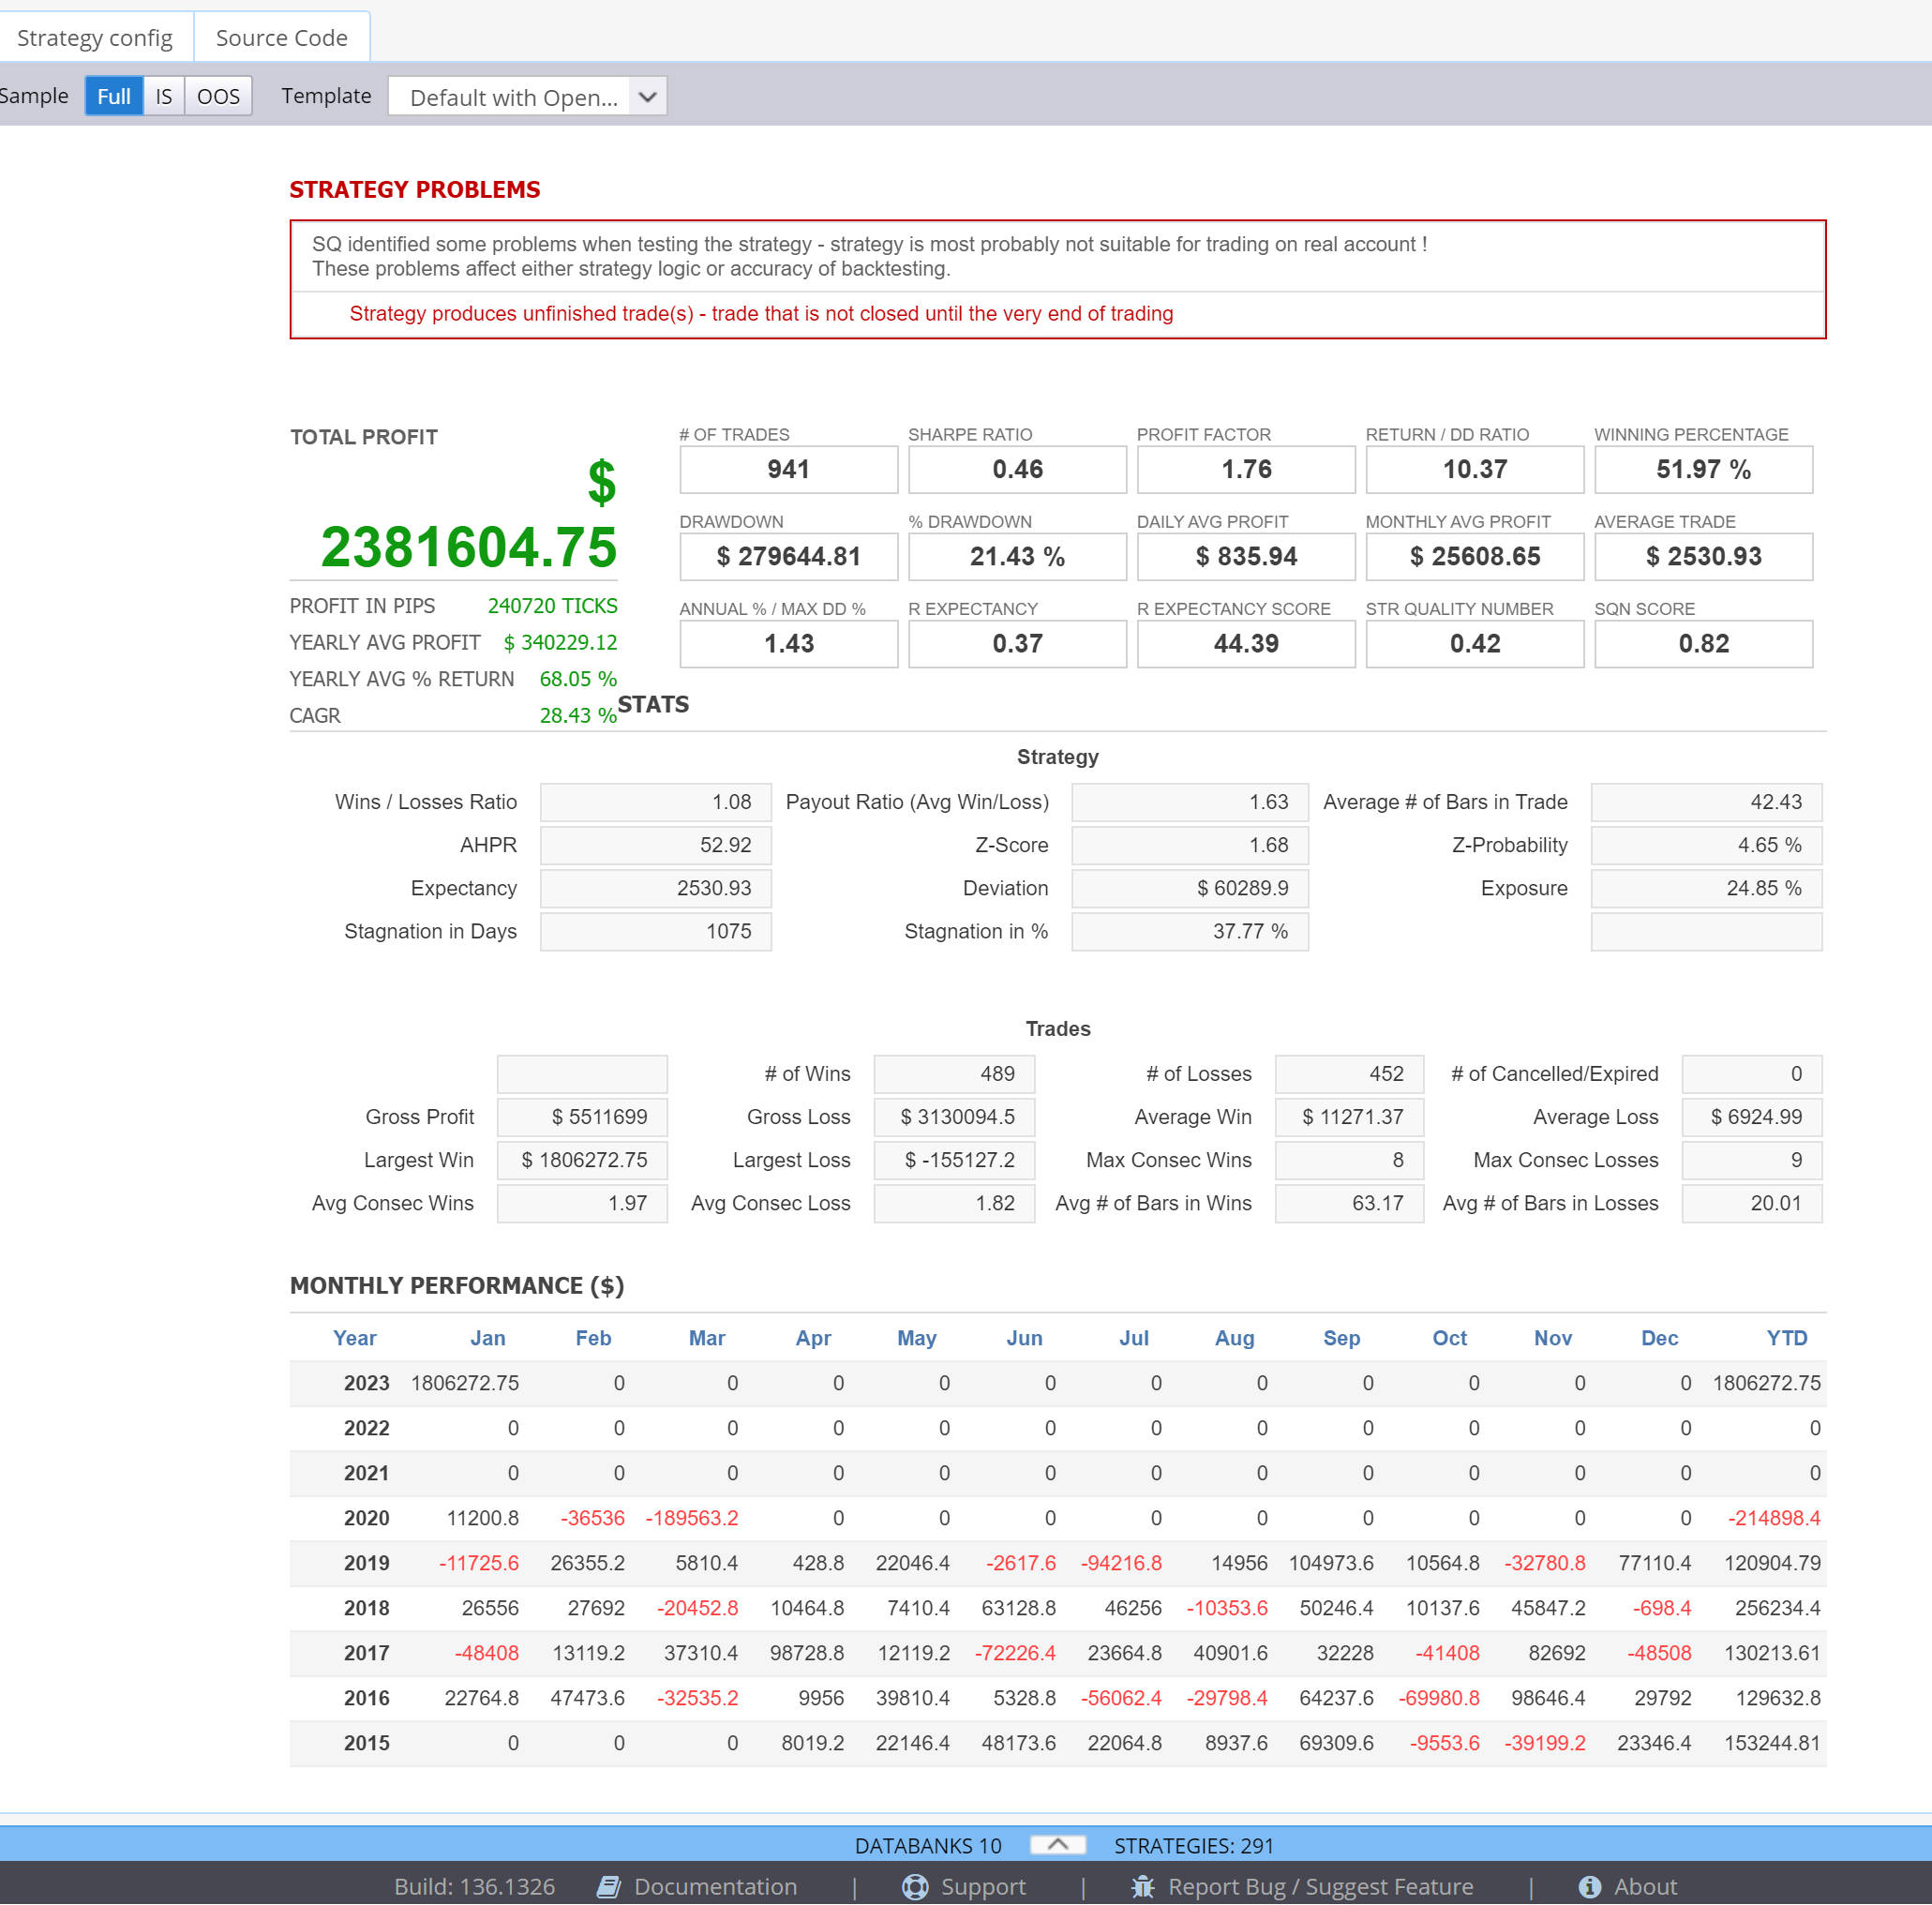
MC's monthly performance report is also calculated strictly according to the openprofit within the monthly time frame, which I think is very reasonable. SQ calculated monthly and annual performance according to the closing time or open time of the tradee. For example, the two strategies in the attached figure. For example, when a trade enters the market on March 30 and exits on May 2, the profit in April in the SQ monthly report is 0. Another strategy has a trade that has been held for more than two years, because the commodity has experienced an unprecedented trend, and the monthly profit is all 0, which cannot reflect the actual monthly profit and loss (the robustness of the strategy with too few trade is not considered here. ).it is obviously distorted.for observing the details of profit data from monthly performance and trade analysis.
So,in the Multicharts engine, it is strongly recommended that the monthly profit and annual profit in monthly performance and trade analysis be calculated according to openprofit, and a time option is added to trade analysis (as shown in the attached picture, and it should be the default option), whether it is from the accuracy of the strategy cycle performance evaluation or It is consistent with the calculation logic of the trading engine, so the implementation is more reasonable and meaningful. Thanks
binhsir
05.02.2023 04:53Add a new difference.
d. huge portfolio correlation difference between SQ and MC
Refer to the new task.
binhsir
06.03.2023 14:29Description changed:
Probably most sq users use MT4/% for trading. But i'm Multicharts user, because it is a legal system trading software in both the US market and emerging markets for trading futures and stocks. As we all know, the strategy developed in sq must be finally tested and verified under the trading platform. Unfortunately, The backtest reports of the two platforms are usually more or less different, sometimes very big.Include net profit, total number of trades, and profit distribution per year. It has to take me quite a bit of time to do this, especially when i am building a big portfolio. The differences due to different settings are not within the scope of this discussion. I think there are several reasons:
1.Some strategies trigger a bug in SQ(For example sq4_9829, recently I discovered that SQ generate false source code once using MA indicator).
2. Opening times have been adjusted historically in some emerging markets .For example, the opening time is adjusted from 9:15 to 9:30.This makes a carriage return difference to the M30's strategy.The default cutting bar method in MC is 9:15-9:45,9:45-10:15,and so on.(Of course, this can also be understood as session setting is different.)
3.Three computational differences the SQ engine and the MC engine.
a.Comparing the backtest reports of sq and MC, even though Net profit and the total number of trades are exactly the same, we will find different annual profits in their respective annual cycle reports. The main reason is that MC will calculate the Openpositionprofit in each year period for trade that span two different years. It is not according to the entry time or exit time of the trade.
b.The logic of slippage calculation is inconsistent between the two platform, which can be referred to the report sq4_9660.
c. Slippage calculation bug when using the money management method, which can be referred to the report https://roadmap.strategyquant.com/tasks/sq4_010008
d.Differences in the calculation of commision. Although error in this reason is the smallest of several factors. For many futures and stocks in emerging markets, commission is usually calculated persentage based by entry amount and exit amont. So SQ should be add percentage based per side option.
e. Huge portfolio correlation difference bettween SQ and MC, which can be reffered to the task https://roadmap.strategyquant.com/tasks/sq4_9928
To sum up, I think it is very necessary to optimize these three known calculation differences in order to greatly save the time of the last step, the comparison and verification of the backtest reports of the two platforms. Once optimized, finding other bugs or problems can be very efficient.
binhsir
06.03.2023 14:30Description changed:
Probably most sq users use MT4/5 for trading. But i'm Multicharts user, because it is a legal system trading software in both the US market and emerging markets for trading futures and stocks. As we all know, the strategy developed in sq must be finally tested and verified under the trading platform. Unfortunately, The backtest reports of the two platforms are usually more or less different, sometimes very big.Include net profit, total number of trades, and profit distribution per year. It has to take me quite a bit of time to do this, especially when i am building a big portfolio. The differences due to different settings are not within the scope of this discussion. I think there are several reasons:
1.Some strategies trigger a bug in SQ(For example sq4_9829, recently I discovered that SQ generate false source code once using MA indicator).
2. Opening times have been adjusted historically in some emerging markets .For example, the opening time is adjusted from 9:15 to 9:30.This makes a carriage return difference to the M30's strategy.The default cutting bar method in MC is 9:15-9:45,9:45-10:15,and so on.(Of course, this can also be understood as session setting is different.)
3.Three computational differences the SQ engine and the MC engine.
a.Comparing the backtest reports of sq and MC, even though Net profit and the total number of trades are exactly the same, we will find different annual profits in their respective annual cycle reports. The main reason is that MC will calculate the Openpositionprofit in each year period for trade that span two different years. It is not according to the entry time or exit time of the trade.
b.The logic of slippage calculation is inconsistent between the two platform, which can be referred to the report sq4_9660.
c. Slippage calculation bug when using the money management method, which can be referred to the report https://roadmap.strategyquant.com/tasks/sq4_010008
d.Differences in the calculation of commision. Although error in this reason is the smallest of several factors. For many futures and stocks in emerging markets, commission is usually calculated persentage based by entry amount and exit amont. So SQ should be add percentage based per side option.
e. Huge portfolio correlation difference bettween SQ and MC, which can be reffered to the task https://roadmap.strategyquant.com/tasks/sq4_9928
To sum up, I think it is very necessary to optimize these three known calculation differences in order to greatly save the time of the last step, the comparison and verification of the backtest reports of the two platforms. Once optimized, finding other bugs or problems can be very efficient.
binhsir
08.03.2023 12:01Description changed:
Probably most sq users use MT4/5 for trading. But i'm Multicharts user, because it is a legal system trading software in both the US market and emerging markets for trading futures and stocks. As we all know, the strategy developed in sq must be finally tested and verified under the trading platform. Unfortunately, The backtest reports of the two platforms are usually more or less different, sometimes very big.Include net profit, total number of trades, and profit distribution per year. It has to take me quite a bit of time to do this, especially when i am building a big portfolio. The differences due to different settings are not within the scope of this discussion. I think there are several reasons:
1.Some strategies trigger a bug in SQ(For example sq4_9829, recently I discovered that SQ generate false source code once using MA indicator).
2. Opening times have been adjusted historically in some emerging markets .For example, the opening time is adjusted from 9:15 to 9:30.This makes a carriage return difference to the M30's strategy.The default cutting bar method in MC is 9:15-9:45,9:45-10:15,and so on.(Of course, this can also be understood as session setting is different.)
3.Three computational differences the SQ engine and the MC engine.
a.Comparing the backtest reports of sq and MC, even though Net profit and the total number of trades are exactly the same, we will find different annual profits and monthly profit in period reports. Many strategies that have a long average holding time will show a profit of 0 for many months.The main reason is that MC calculate the Openpositionprofit in each year,month,day for trade. SQ calculate simply according to the entry time or exit time of the trade. Some statistical metric/column related to cyclical profits may gernareate bigger bias in SQX, such as Sharp ratio, Sortino ratio. So you will find that even though the default value of the risk-free return in SQ is 5%, but Sharp ratio in SQ is often much higher than MC's value even risk-free return be set 2%.
b.The logic of slippage calculation is inconsistent between the two platform, which can be referred to the report sq4_9660.
c. Slippage calculation bug when using the money management method, which can be referred to the report https://roadmap.strategyquant.com/tasks/sq4_010008
d.Differences in the calculation of commision. Although error in this reason is the smallest of several factors. For many futures and stocks in emerging markets, commission is usually calculated persentage based by entry amount and exit amont. So SQ should be add percentage based per side option.
e. Huge portfolio correlation difference bettween SQ and MC, which can be reffered to the task https://roadmap.strategyquant.com/tasks/sq4_9928
To sum up, I think it is very necessary to optimize these three known calculation differences in order to greatly save the time of the last step, the comparison and verification of the backtest reports of the two platforms. Once optimized, finding other bugs or problems can be very efficient.
binhsir
12.03.2023 04:07Description changed:
Probably most sq users use MT4/5 for trading. But i'm Multicharts user, because it is a legal system trading software in both the US market and emerging markets for trading futures and stocks. As we all know, the strategy developed in sq must be finally tested and verified under the trading platform. Unfortunately, The backtest reports of the two platforms are usually more or less different, sometimes very big.Include net profit, total number of trades, and profit distribution per year. It has to take me quite a bit of time to do this, especially when i am building a big portfolio. The differences due to different settings are not within the scope of this discussion. I think there are several reasons:
1.Some strategies trigger a bug in SQ(For example sq4_9829, recently I discovered that SQ generate false source code once using MA indicator).
2. Opening times have been adjusted historically in some emerging markets .For example, the opening time is adjusted from 9:15 to 9:30.This makes a carriage return difference to the M30's strategy.The default cutting bar method in MC is 9:15-9:45,9:45-10:15,and so on.(Of course, this can also be understood as session setting is different.)
3. metric calculation bug, for example Calmar ratio which can be referred to the task https://roadmap.strategyquant.com/tasks/sq4_010020
4.Three computational differences the SQ engine and the MC engine.
a.Comparing the backtest reports of sq and MC, even though Net profit and the total number of trades are exactly the same, we will find different annual profits and monthly profit in period reports. Many strategies that have a long average holding time will show a profit of 0 for many months.The main reason is that MC calculate the Openpositionprofit in each year,month,day for trade. SQ calculate simply according to the entry time or exit time of the trade. Some statistical metric/column related to cyclical profits may gernareate bigger bias in SQX, such as Sharp ratio, Sortino ratio. So you will find that even though the default value of the risk-free return in SQ is 5%, but Sharp ratio in SQ is often much higher than MC's value even risk-free return be set 2%.
b.The logic of slippage calculation is inconsistent between the two platform, which can be referred to the report sq4_9660.
c. Slippage calculation bug when using the money management method, which can be referred to the report https://roadmap.strategyquant.com/tasks/sq4_010008
d.Differences in the calculation of commision. Although error in this reason is the smallest of several factors. For many futures and stocks in emerging markets, commission is usually calculated persentage based by entry amount and exit amont. So SQ should be add percentage based per side option.
e. Huge portfolio correlation difference bettween SQ and MC, which can be reffered to the task https://roadmap.strategyquant.com/tasks/sq4_9928
To sum up, I think it is very necessary to optimize these three known calculation differences in order to greatly save the time of the last step, the comparison and verification of the backtest reports of the two platforms. Once optimized, finding other bugs or problems can be very efficient.
binhsir
07.06.2023 14:17Description changed:
Probably most sq users use MT4/5 for trading. But i'm Multicharts user, because it is a legal system trading software in both the US market and emerging markets for trading futures and stocks. As we all know, the strategy developed in sq must be finally tested and verified under the trading platform. Unfortunately, The backtest reports of the two platforms are usually more or less different, sometimes very big.Include net profit, total number of trades, and profit distribution per year. It has to take me quite a bit of time to do this, especially when i am building a big portfolio. The differences due to different settings are not within the scope of this discussion. I think there are several reasons:
1.Some strategies trigger a bug in SQ(For example sq4_9829, recently I discovered that SQ generate false source code once using MA indicator).
2. Opening times have been adjusted historically in some emerging markets .For example, the opening time is adjusted from 9:15 to 9:30.This makes a carriage return difference to the M30's strategy.The default cutting bar method in MC is 9:15-9:45,9:45-10:15,and so on.(Of course, this can also be understood as session setting is different.)
3. metric calculation bug, for example Calmar ratio which can be referred to the task https://roadmap.strategyquant.com/tasks/sq4_010020
4.Three computational differences the SQ engine and the MC engine.
a.Comparing the backtest reports of sq and MC, even though Net profit and the total number of trades are exactly the same, we will find different annual profits and monthly profit in period reports. Many strategies that have a long average holding time will show a profit of 0 for many months.The main reason is that MC calculate the Openpositionprofit in each year,month,day for trade. SQ calculate simply according to the entry time or exit time of the trade. Some statistical metric/column related to cyclical profits may gernareate bigger bias in SQX, such as Sharp ratio, Sortino ratio. So you will find that even though the default value of the risk-free return in SQ is 5%, but Sharp ratio in SQ is often much higher than MC's value even risk-free return be set 2%.
b.The logic of slippage calculation is inconsistent between the two platform, which can be referred to the report sq4_9660.
c. Slippage calculation bug when using the money management method, which can be referred to the report https://roadmap.strategyquant.com/tasks/sq4_010008
d.Differences in the calculation of commision. Although error in this reason is the smallest of several factors. For many futures and stocks in emerging markets, commission is usually calculated persentage based by entry amount and exit amont. So SQ should be add percentage based per side option.
e. Huge portfolio correlation difference bettween SQ and MC, which can be reffered to the task https://roadmap.strategyquant.com/tasks/sq4_9928
f. differences in the treatment of max refernce bars. As you can see in task: Differences in the treatment of max reference bars between MC and SQ - Strategy Quant
To sum up, I think it is very necessary to optimize these three known calculation differences in order to greatly save the time of the last step, the comparison and verification of the backtest reports of the two platforms. Once optimized, finding other bugs or problems can be very efficient.
binhsir
23.07.2023 03:53Description changed:
Probably most sq users use MT4/5 for trading. But i'm Multicharts user, because it is a legal system trading software in both the US market and emerging markets for trading futures and stocks. As we all know, the strategy developed in sq must be finally tested and verified under the trading platform. Unfortunately, The backtest reports of the two platforms are usually more or less different, sometimes very big.Include net profit, total number of trades, and profit distribution per year. It has to take me quite a bit of time to do this, especially when i am building a big portfolio. The differences due to different settings are not within the scope of this discussion. I think there are several reasons:
1.Some strategies trigger a bug in SQ(For example sq4_9829, recently I discovered that SQ generate false source code once using MA indicator).
2. Opening times have been adjusted historically in some emerging markets .For example, the opening time is adjusted from 9:15 to 9:30.This makes a carriage return difference to the M30's strategy.The default cutting bar method in MC is 9:15-9:45,9:45-10:15,and so on.(Of course, this can also be understood as session setting is different.)
3. metric calculation bug, for example Calmar ratio which can be referred to the task https://roadmap.strategyquant.com/tasks/sq4_010020
4.Three computational differences the SQ engine and the MC engine.
a.Comparing the backtest reports of sq and MC, even though Net profit and the total number of trades are exactly the same, we will find different annual profits and monthly profit in period reports. Many strategies that have a long average holding time will show a profit of 0 for many months.The main reason is that MC calculate the Openpositionprofit in each year,month,day for trade. SQ calculate simply according to the entry time or exit time of the trade. Some statistical metric/column related to cyclical profits may gernareate bigger bias in SQX, such as Sharp ratio, Sortino ratio. So you will find that even though the default value of the risk-free return in SQ is 5%, but Sharp ratio in SQ is often much higher than MC's value even risk-free return be set 2%.
b.The logic of slippage calculation is inconsistent between the two platform, which can be referred to the report sq4_9660.
c. Slippage calculation bug when using the money management method, which can be referred to the report https://roadmap.strategyquant.com/tasks/sq4_010008
d.Differences in the calculation of commision. Although error in this reason is the smallest of several factors. For many futures and stocks in emerging markets, commission is usually calculated persentage based by entry amount and exit amont. So SQ should be add percentage based per side option.
e. Huge portfolio correlation difference bettween SQ and MC, which can be reffered to the task https://roadmap.strategyquant.com/tasks/sq4_9928
f. differences in the treatment of max refernce bars. As you can see in task:
Differences in the treatment of max reference bars between MC and SQ - Strategy Quant
Second bug about max reference bar - Strategy Quant
To sum up, I think it is very necessary to optimize these three known calculation differences in order to greatly save the time of the last step, the comparison and verification of the backtest reports of the two platforms. Once optimized, finding other bugs or problems can be very efficient.
binhsir
23.07.2023 03:57binhsir
24.09.2023 03:04Description changed:
Probably most sq users use MT4/5 for trading. But i'm Multicharts user, because it is a legal system trading software in both the US market and emerging markets for trading futures and stocks. As we all know, the strategy developed in sq must be finally tested and verified under the trading platform. Unfortunately, The backtest reports of the two platforms are usually more or less different, sometimes very big.Include net profit, total number of trades, and profit distribution per year. It has to take me quite a bit of time to do this, especially when i am building a big portfolio. The differences due to different settings are not within the scope of this discussion. I think there are several reasons:
1.Some strategies trigger a bug in SQ(For example sq4_9829, recently I discovered that SQ generate false source code once using MA indicator).
2. Opening times have been adjusted historically in some emerging markets .For example, the opening time is adjusted from 9:15 to 9:30.This makes a carriage return difference to the M30's strategy.The default cutting bar method in MC is 9:15-9:45,9:45-10:15,and so on.(Of course, this can also be understood as session setting is different.)
3. metric calculation bug, for example Calmar ratio which can be referred to the task https://roadmap.strategyquant.com/tasks/sq4_010020
4.Three computational differences the SQ engine and the MC engine.
a.Comparing the backtest reports of sq and MC, even though Net profit and the total number of trades are exactly the same, we will find different annual profits and monthly profit in period reports. Many strategies that have a long average holding time will show a profit of 0 for many months.The main reason is that MC calculate the Openpositionprofit in each year,month,day for trade. SQ calculate simply according to the entry time or exit time of the trade. Some statistical metric/column related to cyclical profits may gernareate bigger bias in SQX, such as Sharp ratio, Sortino ratio. So you will find that even though the default value of the risk-free return in SQ is 5%, but Sharp ratio in SQ is often much higher than MC's value even risk-free return be set 2%. This way of calculation will lead to a larger error when calculating Portfolio Sharpe/Sortino ratio.
b. Huge portfolio correlation difference bettween SQ and MC, which can be reffered to the task https://roadmap.strategyquant.com/tasks/sq4_9928
c.The logic of slippage calculation is inconsistent between the two platform, which can be referred to the report sq4_9660.
d. Slippage calculation bug when using the money management method, which can be referred to the report https://roadmap.strategyquant.com/tasks/sq4_010008
e.Differences in the calculation of commision. Although error in this reason is the smallest of several factors. For many futures and stocks in emerging markets, commission is usually calculated persentage based by entry amount and exit amont. So SQ should be add percentage based per side option.
f. differences in the treatment of max refernce bars. As you can see in task:
Differences in the treatment of max reference bars between MC and SQ - Strategy Quant
Second bug about max reference bar - Strategy Quant
To sum up, I think it is very necessary to optimize these three known calculation differences in order to greatly save the time of the last step, the comparison and verification of the backtest reports of the two platforms. Once optimized, finding other bugs or problems can be very efficient.
binhsir
24.09.2023 05:00Description changed:
Probably most sq users use MT4/5 for trading. But i'm Multicharts user, because it is a legal system trading software in both the US market and emerging markets for trading futures and stocks. As we all know, the strategy developed in sq must be finally tested and verified under the trading platform. Unfortunately, The backtest reports of the two platforms are usually more or less different, sometimes very big.Include net profit, total number of trades, and profit distribution per year. It has to take me quite a bit of time to do this, especially when i am building a big portfolio. The differences due to different settings are not within the scope of this discussion. I think there are several reasons:
1.Some strategies trigger a bug in SQ(For example sq4_9829, recently I discovered that SQ generate false source code once using MA indicator).
2. Opening times have been adjusted historically in some emerging markets .For example, the opening time is adjusted from 9:15 to 9:30.This makes a carriage return difference to the M30's strategy.The default cutting bar method in MC is 9:15-9:45,9:45-10:15,and so on.(Of course, this can also be understood as session setting is different.)
3. metric calculation bug, for example Calmar ratio which can be referred to the task https://roadmap.strategyquant.com/tasks/sq4_010020
4.Three computational differences the SQ engine and the MC engine.
a.Comparing the backtest reports of sq and MC, even though Net profit and the total number of trades are exactly the same, we will find different annual profits and monthly profit in period reports. Many strategies that have a long average holding time will show a profit of 0 for many months.The main reason is that MC calculate the Openpositionprofit in each year,month,day for trade. SQ calculate simply according to the entry time or exit time of the trade. Some statistical metric/column related to cyclical profits may gernareate bigger bias in SQX, such as Sharp ratio, Sortino ratio. So you will find that even though the default value of the risk-free return in SQ is 5%, but Sharp ratio in SQ is often much higher than MC's value even risk-free return be set 2%. This way of calculation will lead to a larger error when calculating Portfolio Sharpe/Sortino ratio.
b. Huge portfolio correlation difference bettween SQ and MC, which can be reffered to the task https://roadmap.strategyquant.com/tasks/sq4_9928
c.The logic of slippage calculation is inconsistent between the two platform, which can be referred to the report Error of slippage calculation between Multicharts and SQX - Strategy Quant.
d. Slippage calculation bug when using the money management method, which can be referred to the report https://roadmap.strategyquant.com/tasks/sq4_010008
e.Differences in the calculation of commision. Although error in this reason is the smallest of several factors. For many futures and stocks in emerging markets, commission is usually calculated persentage based by entry amount and exit amont. So SQ should be add percentage based per side option.
f. differences in the treatment of max refernce bars. As you can see in task:
Differences in the treatment of max reference bars between MC and SQ - Strategy Quant
Second bug about max reference bar - Strategy Quant
To sum up, I think it is very necessary to optimize these three known calculation differences in order to greatly save the time of the last step, the comparison and verification of the backtest reports of the two platforms. Once optimized, finding other bugs or problems can be very efficient.
© Copyright. All rights reserved. ProjectPanel.com
